| Red | Green | Blue | |
| z | 17.64 | ||
| znorm | Inf | ||
| sky | -Inf | -Inf | -Inf |
| S/N | 21.7 | 38.3 | 51.7 |
| S/N(c) | 0.0 | 0.0 | 0.0 |
| SN(E/C) |
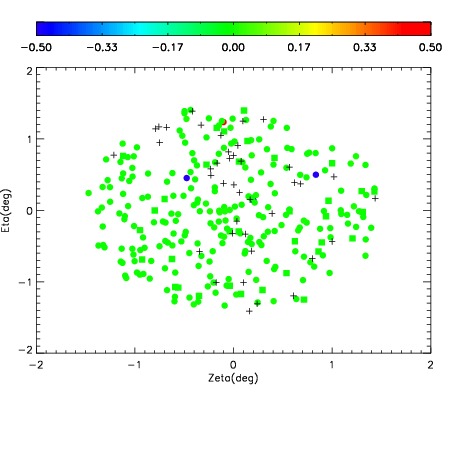
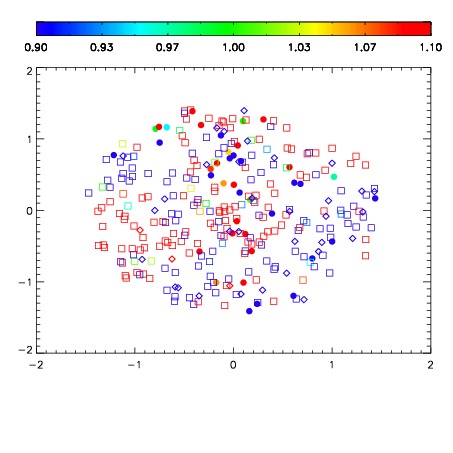
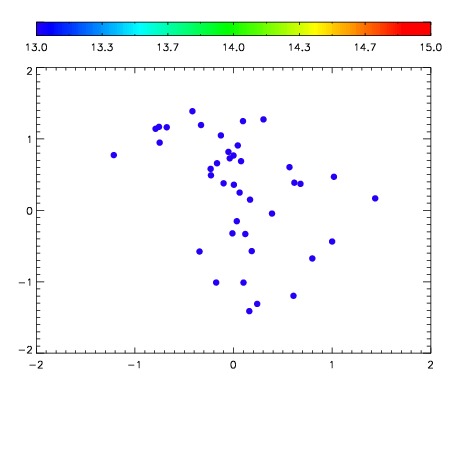

| Frame | Nreads | Zeropoints | Mag plots | Spatial mag deviation | Spatial sky 16325A emission deviations (filled: sky, open: star) | Spatial sky continuum emission | Spatial sky telluric CO2 absorption deviations (filled: H < 10) | |||||||||||||||||||||||
| 0 | 0 |
|
|
|
|
|
|
| IPAIR | NAME | SHIFT | NEWSHIFT | S/N | NAME | SHIFT | NEWSHIFT | S/N |
| 0 | 02610056 | 0.431736 | 0.00000 | 172.439 | 02610057 | -0.000592292 | 0.432328 | 172.125 |
| 1 | 02610055 | 0.430760 | 0.000975996 | 180.008 | 02610053 | 0.000860647 | 0.430875 | 174.926 |
| 2 | 02610052 | 0.430845 | 0.000891000 | 176.347 | 02610054 | -0.00319606 | 0.434932 | 174.392 |
| 3 | 02610051 | 0.428953 | 0.00278300 | 175.839 | 02610050 | 0.00000 | 0.431736 | 174.274 |