| Red | Green | Blue | |
| z | 17.64 | ||
| znorm | Inf | ||
| sky | -Inf | -Inf | -Inf |
| S/N | 17.9 | 31.6 | 40.8 |
| S/N(c) | 0.0 | 0.0 | 0.0 |
| SN(E/C) |
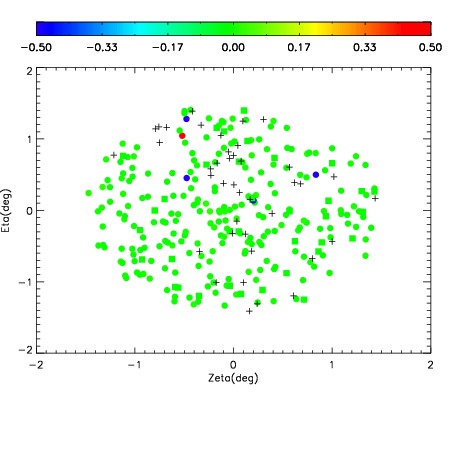
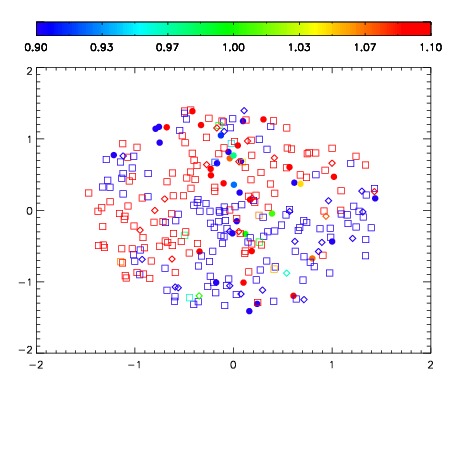
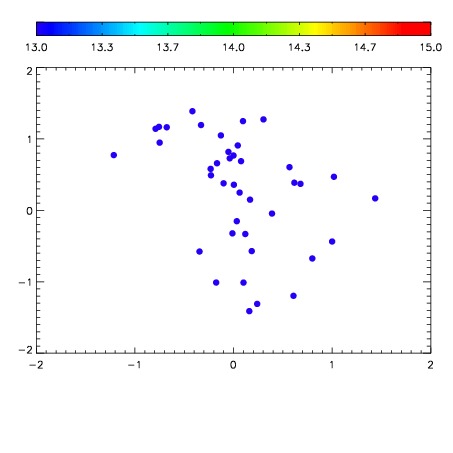

| Frame | Nreads | Zeropoints | Mag plots | Spatial mag deviation | Spatial sky 16325A emission deviations (filled: sky, open: star) | Spatial sky continuum emission | Spatial sky telluric CO2 absorption deviations (filled: H < 10) | |||||||||||||||||||||||
| 0 | 0 |
|
|
|
|
|
|
| IPAIR | NAME | SHIFT | NEWSHIFT | S/N | NAME | SHIFT | NEWSHIFT | S/N |
| 0 | 02810029 | 0.415131 | 0.00000 | 134.578 | 02810027 | 0.00000 | 0.415131 | 137.844 |
| 1 | 02810033 | 0.414018 | 0.00111300 | 151.820 | 02810034 | -0.00231999 | 0.417451 | 144.225 |
| 2 | 02810032 | 0.413288 | 0.00184301 | 147.266 | 02810031 | -0.00373769 | 0.418869 | 141.680 |
| 3 | 02810028 | 0.410864 | 0.00426701 | 136.895 | 02810030 | -0.000118501 | 0.415249 | 139.551 |