| Red | Green | Blue | |
| z | 17.64 | ||
| znorm | Inf | ||
| sky | -Inf | -Inf | -Inf |
| S/N | 25.0 | 47.6 | 56.5 |
| S/N(c) | 0.0 | 0.0 | 0.0 |
| SN(E/C) |
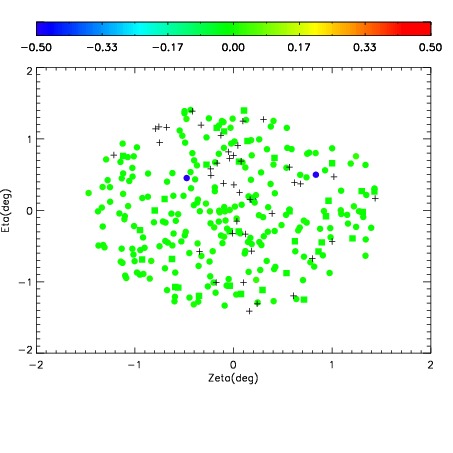
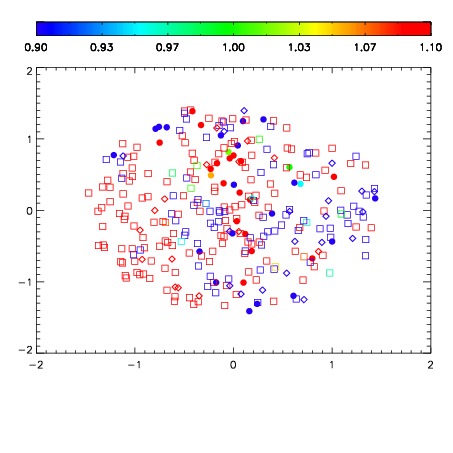
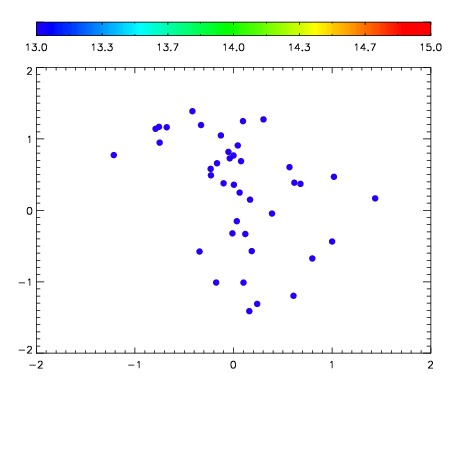

| Frame | Nreads | Zeropoints | Mag plots | Spatial mag deviation | Spatial sky 16325A emission deviations (filled: sky, open: star) | Spatial sky continuum emission | Spatial sky telluric CO2 absorption deviations (filled: H < 10) | |||||||||||||||||||||||
| 0 | 0 |
|
|
|
|
|
|
| IPAIR | NAME | SHIFT | NEWSHIFT | S/N | NAME | SHIFT | NEWSHIFT | S/N |
| 0 | 03120057 | 0.499510 | 0.00000 | 206.743 | 03120054 | 0.00257289 | 0.496937 | 210.353 |
| 1 | 03120052 | 0.492664 | 0.00684598 | 205.877 | 03120055 | -0.00178744 | 0.501297 | 206.697 |
| 2 | 03120056 | 0.499081 | 0.000429004 | 201.053 | 03120058 | -0.000169434 | 0.499679 | 202.286 |
| 3 | 03120053 | 0.493252 | 0.00625798 | 199.262 | 03120051 | 0.000481197 | 0.499029 | 201.498 |
| 4 | 03120048 | 0.495837 | 0.00367299 | 194.608 | 03120050 | 0.00219444 | 0.497316 | 198.866 |
| 5 | 03120049 | 0.496715 | 0.00279498 | 177.244 | 03120047 | 0.00000 | 0.499510 | 186.224 |