| Red | Green | Blue | |
| z | 17.64 | ||
| znorm | Inf | ||
| sky | -Inf | -Inf | -Inf |
| S/N | 23.1 | 43.3 | 48.3 |
| S/N(c) | 0.0 | 0.0 | 0.0 |
| SN(E/C) |
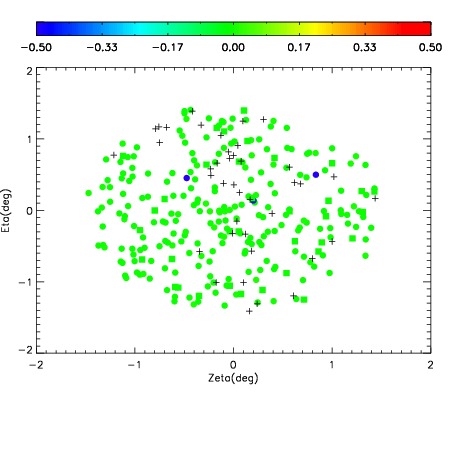
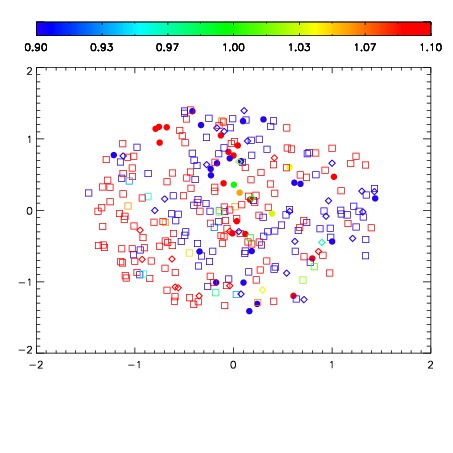
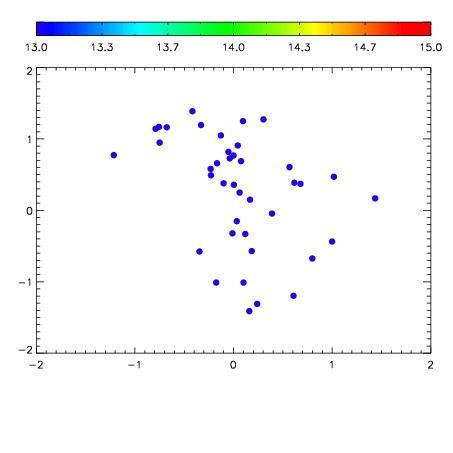

| Frame | Nreads | Zeropoints | Mag plots | Spatial mag deviation | Spatial sky 16325A emission deviations (filled: sky, open: star) | Spatial sky continuum emission | Spatial sky telluric CO2 absorption deviations (filled: H < 10) | |||||||||||||||||||||||
| 0 | 0 |
|
|
|
|
|
|
| IPAIR | NAME | SHIFT | NEWSHIFT | S/N | NAME | SHIFT | NEWSHIFT | S/N |
| 0 | 03430036 | 0.506307 | 0.00000 | 205.131 | 03430037 | 0.00125438 | 0.505053 | 202.216 |
| 1 | 03430040 | 0.504906 | 0.00140101 | 213.947 | 03430041 | 0.000365497 | 0.505942 | 213.771 |
| 2 | 03430039 | 0.504162 | 0.00214499 | 207.706 | 03430038 | 0.000291147 | 0.506016 | 205.734 |
| 3 | 03430035 | 0.505084 | 0.00122303 | 204.540 | 03430034 | 0.00000 | 0.506307 | 197.376 |