| Red | Green | Blue | |
| z | 17.64 | ||
| znorm | Inf | ||
| sky | -Inf | -Inf | -Inf |
| S/N | 10.0 | 21.3 | 22.2 |
| S/N(c) | 0.0 | 0.0 | 0.0 |
| SN(E/C) |
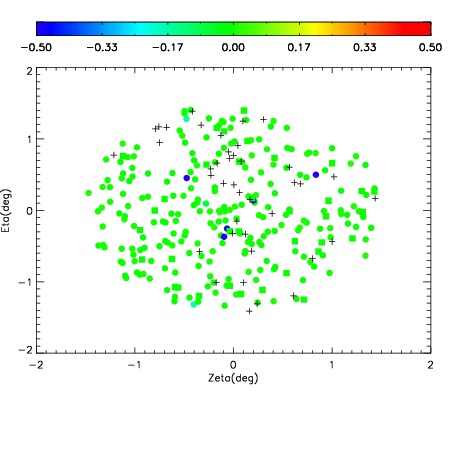
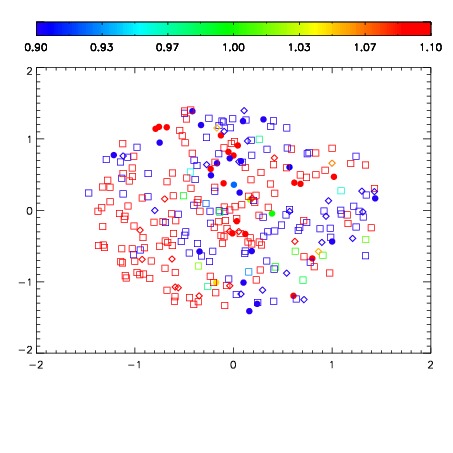
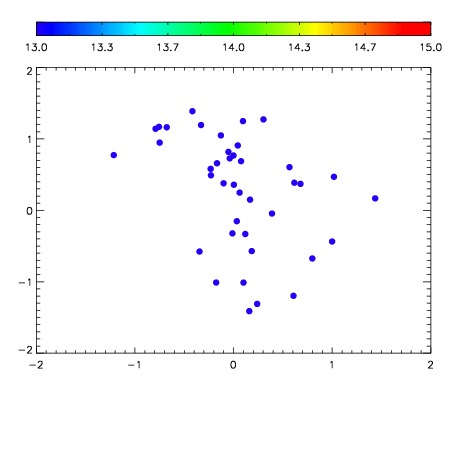

| Frame | Nreads | Zeropoints | Mag plots | Spatial mag deviation | Spatial sky 16325A emission deviations (filled: sky, open: star) | Spatial sky continuum emission | Spatial sky telluric CO2 absorption deviations (filled: H < 10) | |||||||||||||||||||||||
| 0 | 0 |
|
|
|
|
|
|
| IPAIR | NAME | SHIFT | NEWSHIFT | S/N | NAME | SHIFT | NEWSHIFT | S/N |
| 0 | 03440036 | 0.504537 | 0.00000 | 96.9619 | 03440037 | -0.000181394 | 0.504718 | 91.0135 |
| 1 | 03440032 | 0.503831 | 0.000705957 | 132.809 | 03440030 | 0.00000 | 0.504537 | 138.205 |
| 2 | 03440031 | 0.502632 | 0.00190496 | 128.904 | 03440033 | 0.00132180 | 0.503215 | 118.916 |
| 3 | 03440035 | 0.502347 | 0.00218999 | 102.549 | 03440034 | -0.000211707 | 0.504749 | 117.810 |