| Red | Green | Blue | |
| z | 17.64 | ||
| znorm | Inf | ||
| sky | -Inf | -Inf | -Inf |
| S/N | 23.1 | 40.8 | 45.9 |
| S/N(c) | 0.0 | 0.0 | 0.0 |
| SN(E/C) |

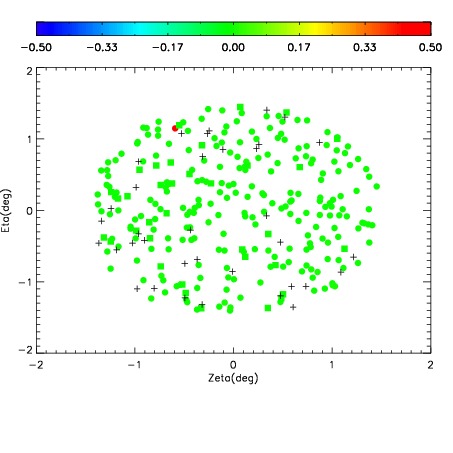
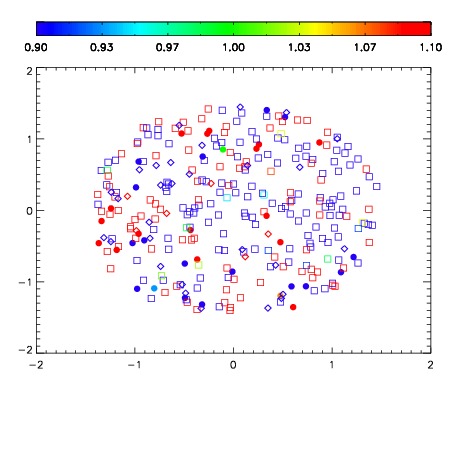
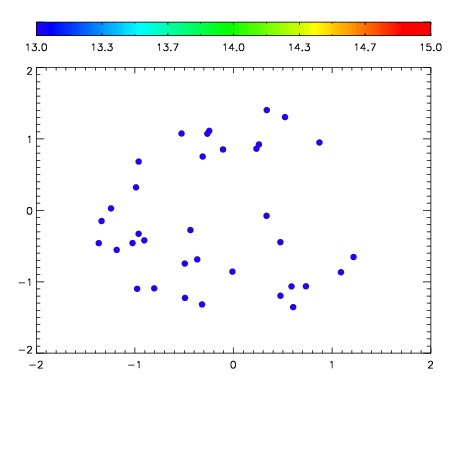

| Frame | Nreads | Zeropoints | Mag plots | Spatial mag deviation | Spatial sky 16325A emission deviations (filled: sky, open: star) | Spatial sky continuum emission | Spatial sky telluric CO2 absorption deviations (filled: H < 10) | |||||||||||||||||||||||
| 0 | 0 |
|
|
|
|
|
|
| IPAIR | NAME | SHIFT | NEWSHIFT | S/N | NAME | SHIFT | NEWSHIFT | S/N |
| 0 | 02870081 | 0.410701 | 0.00000 | 189.864 | 02870082 | -0.00140999 | 0.412111 | 191.233 |
| 1 | 02870077 | 0.410479 | 0.000221997 | 190.187 | 02870075 | 0.00000 | 0.410701 | 191.668 |
| 2 | 02870076 | 0.408912 | 0.00178900 | 187.116 | 02870078 | 0.00120357 | 0.409497 | 178.818 |
| 3 | 02870080 | 0.409878 | 0.000823021 | 171.892 | 02870079 | -0.000544735 | 0.411246 | 174.394 |