| Red | Green | Blue | |
| z | 17.64 | ||
| znorm | Inf | ||
| sky | -Inf | -Inf | -Inf |
| S/N | 30.8 | 52.1 | 57.1 |
| S/N(c) | 0.0 | 0.0 | 0.0 |
| SN(E/C) |
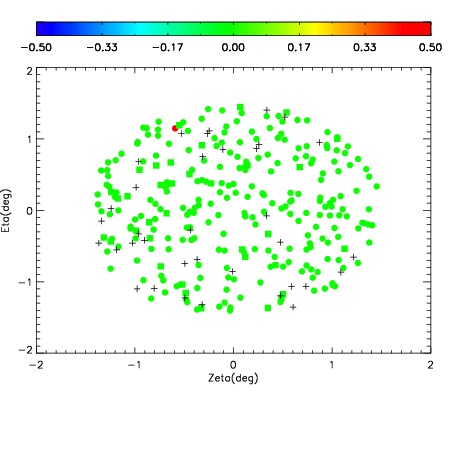

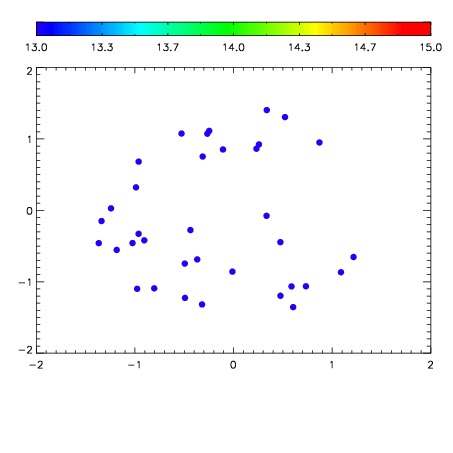

| Frame | Nreads | Zeropoints | Mag plots | Spatial mag deviation | Spatial sky 16325A emission deviations (filled: sky, open: star) | Spatial sky continuum emission | Spatial sky telluric CO2 absorption deviations (filled: H < 10) | |||||||||||||||||||||||
| 0 | 0 |
|
|
|
|
|
|
| IPAIR | NAME | SHIFT | NEWSHIFT | S/N | NAME | SHIFT | NEWSHIFT | S/N |
| 0 | 02910033 | 0.401891 | 0.00000 | 219.800 | 02910030 | 0.000657104 | 0.401234 | 220.803 |
| 1 | 02910029 | 0.398078 | 0.00381300 | 220.698 | 02910031 | -0.000342043 | 0.402233 | 223.033 |
| 2 | 02910032 | 0.401205 | 0.000685990 | 218.853 | 02910034 | 0.000419045 | 0.401472 | 218.416 |
| 3 | 02910028 | 0.397522 | 0.00436899 | 213.401 | 02910027 | 0.00000 | 0.401891 | 210.238 |