| Red | Green | Blue | |
| z | 17.64 | ||
| znorm | Inf | ||
| sky | -Inf | -Inf | -Inf |
| S/N | 28.4 | 49.8 | 52.3 |
| S/N(c) | 0.0 | 0.0 | 0.0 |
| SN(E/C) |

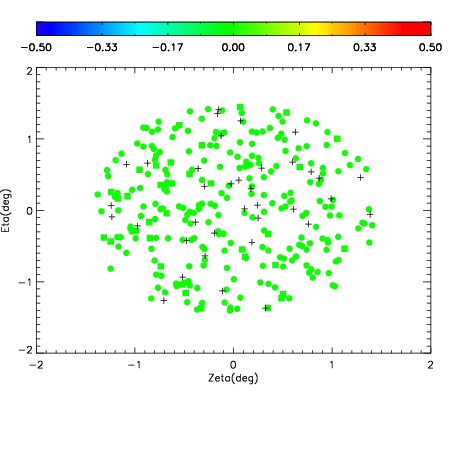
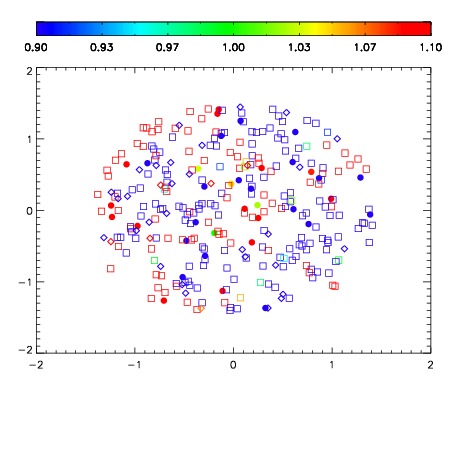
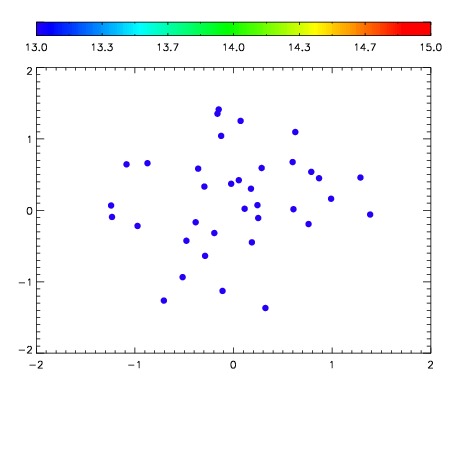

| Frame | Nreads | Zeropoints | Mag plots | Spatial mag deviation | Spatial sky 16325A emission deviations (filled: sky, open: star) | Spatial sky continuum emission | Spatial sky telluric CO2 absorption deviations (filled: H < 10) | |||||||||||||||||||||||
| 0 | 0 |
|
|
|
|
|
|
| IPAIR | NAME | SHIFT | NEWSHIFT | S/N | NAME | SHIFT | NEWSHIFT | S/N |
| 0 | 02860077 | 0.410667 | 0.00000 | 213.156 | 02860079 | -0.00114524 | 0.411812 | 211.849 |
| 1 | 02860080 | 0.408356 | 0.00231099 | 214.733 | 02860082 | 0.000668771 | 0.409998 | 215.665 |
| 2 | 02860081 | 0.409668 | 0.000999004 | 212.674 | 02860078 | 0.000952870 | 0.409714 | 210.772 |
| 3 | 02860076 | 0.409406 | 0.00126100 | 212.259 | 02860075 | 0.00000 | 0.410667 | 205.420 |