| Red | Green | Blue | |
| z | 17.64 | ||
| znorm | Inf | ||
| sky | -Inf | -Inf | -Inf |
| S/N | 28.0 | 47.0 | 49.7 |
| S/N(c) | 0.0 | 0.0 | 0.0 |
| SN(E/C) |
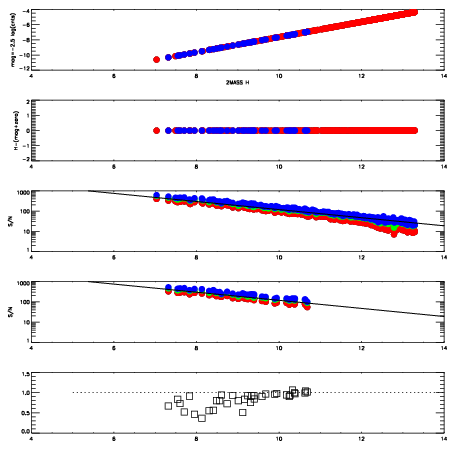
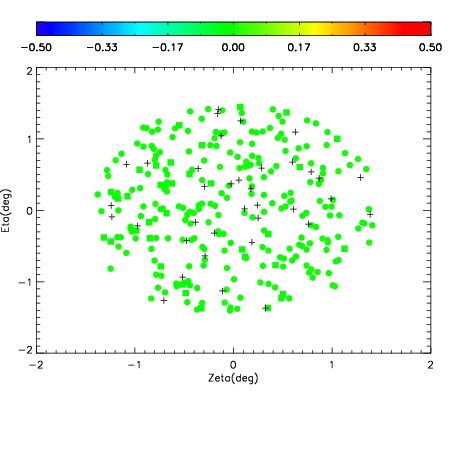

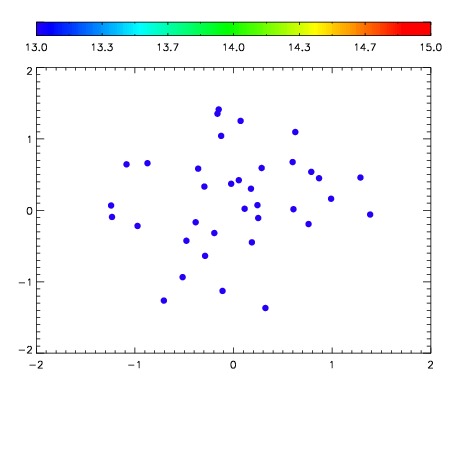

| Frame | Nreads | Zeropoints | Mag plots | Spatial mag deviation | Spatial sky 16325A emission deviations (filled: sky, open: star) | Spatial sky continuum emission | Spatial sky telluric CO2 absorption deviations (filled: H < 10) | |||||||||||||||||||||||
| 0 | 0 |
|
|
|
|
|
|
| IPAIR | NAME | SHIFT | NEWSHIFT | S/N | NAME | SHIFT | NEWSHIFT | S/N |
| 0 | 03680025 | 0.501913 | 0.00000 | 187.086 | 03680023 | 0.000610101 | 0.501303 | 184.308 |
| 1 | 03680020 | 0.498906 | 0.00300702 | 187.195 | 03680026 | 0.00292162 | 0.498991 | 185.619 |
| 2 | 03680024 | 0.501019 | 0.000894010 | 178.521 | 03680019 | 0.00000 | 0.501913 | 182.970 |
| 3 | 03680021 | 0.501537 | 0.000375986 | 177.407 | 03680022 | 0.00144321 | 0.500470 | 182.903 |