| Red | Green | Blue | |
| z | 17.64 | ||
| znorm | Inf | ||
| sky | -Inf | -Inf | -Inf |
| S/N | 12.6 | 25.1 | 27.1 |
| S/N(c) | 0.0 | 0.0 | 0.0 |
| SN(E/C) |
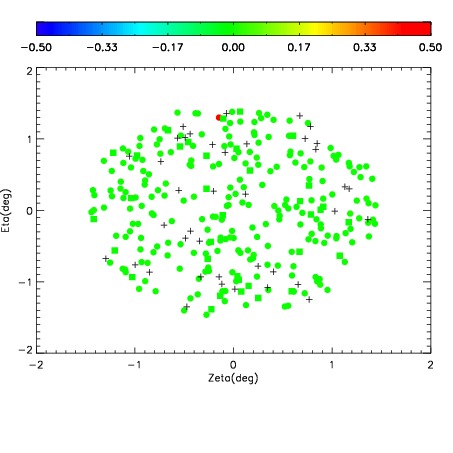
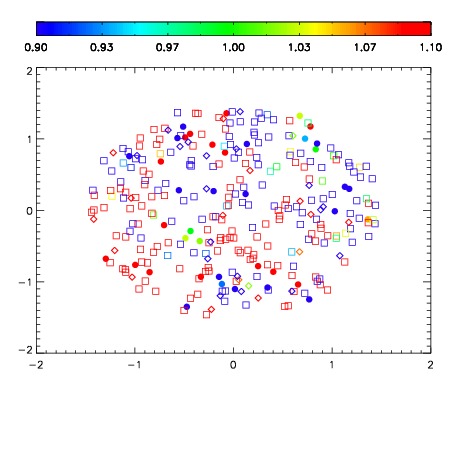
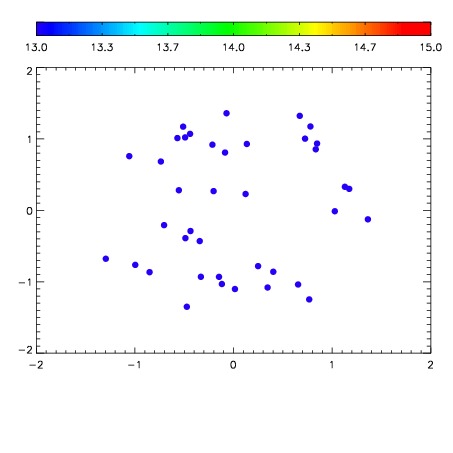

| Frame | Nreads | Zeropoints | Mag plots | Spatial mag deviation | Spatial sky 16325A emission deviations (filled: sky, open: star) | Spatial sky continuum emission | Spatial sky telluric CO2 absorption deviations (filled: H < 10) | |||||||||||||||||||||||
| 0 | 0 |
|
|
|
|
|
|
| IPAIR | NAME | SHIFT | NEWSHIFT | S/N | NAME | SHIFT | NEWSHIFT | S/N |
| 0 | 03100070 | 0.494579 | 0.00000 | 70.4588 | 03100068 | -0.000392411 | 0.494971 | 74.8695 |
| 1 | 03100066 | 0.492610 | 0.00196898 | 166.887 | 03100069 | -0.00128486 | 0.495864 | 132.995 |
| 2 | 03100071 | 0.494498 | 8.09729e-05 | 128.780 | 03100065 | 0.00000 | 0.494579 | 129.602 |
| 3 | 03100067 | 0.493576 | 0.00100300 | 92.3970 | 03100072 | -0.000845663 | 0.495425 | 117.208 |