| Red | Green | Blue | |
| z | 17.64 | ||
| znorm | Inf | ||
| sky | -Inf | -Inf | -Inf |
| S/N | 15.5 | 28.8 | 31.3 |
| S/N(c) | 0.0 | 0.0 | 0.0 |
| SN(E/C) |
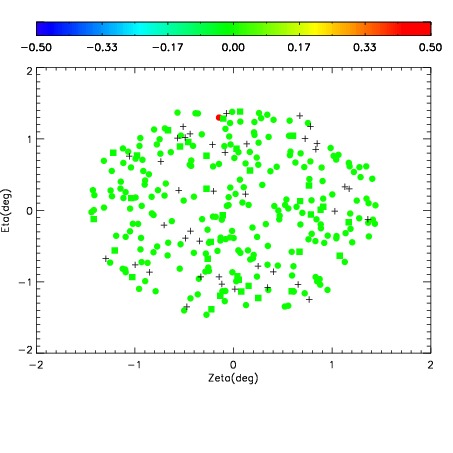
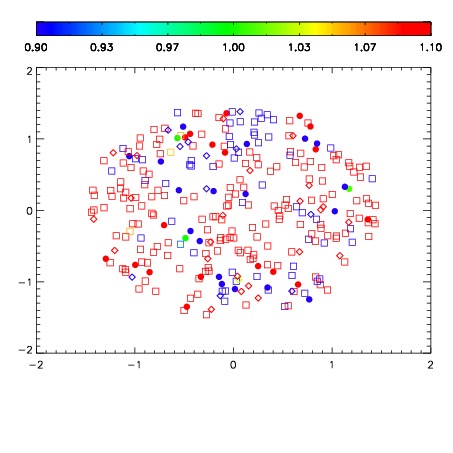
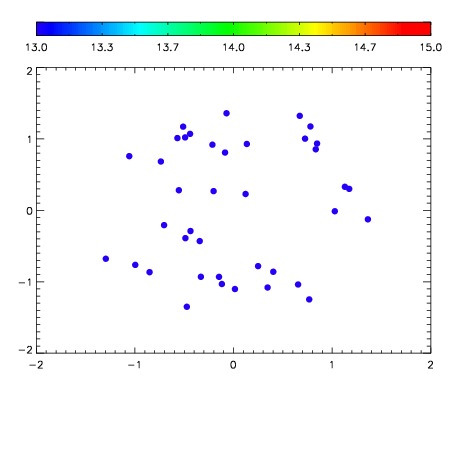

| Frame | Nreads | Zeropoints | Mag plots | Spatial mag deviation | Spatial sky 16325A emission deviations (filled: sky, open: star) | Spatial sky continuum emission | Spatial sky telluric CO2 absorption deviations (filled: H < 10) | |||||||||||||||||||||||
| 0 | 0 |
|
|
|
|
|
|
| IPAIR | NAME | SHIFT | NEWSHIFT | S/N | NAME | SHIFT | NEWSHIFT | S/N |
| 0 | 03110031 | 0.490641 | 0.00000 | 176.779 | 03110032 | 0.00105634 | 0.489585 | 176.572 |
| 1 | 03110030 | 0.489892 | 0.000748992 | 178.265 | 03110033 | 0.000281207 | 0.490360 | 191.876 |
| 2 | 03110034 | 0.484592 | 0.00604901 | 74.7622 | 03110029 | 0.00000 | 0.490641 | 172.311 |