| Red | Green | Blue | |
| z | 17.64 | ||
| znorm | Inf | ||
| sky | -Inf | -Inf | -Inf |
| S/N | 27.4 | 48.9 | 53.0 |
| S/N(c) | 0.0 | 0.0 | 0.0 |
| SN(E/C) |

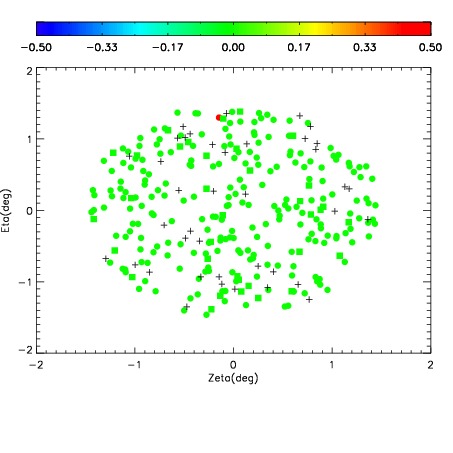
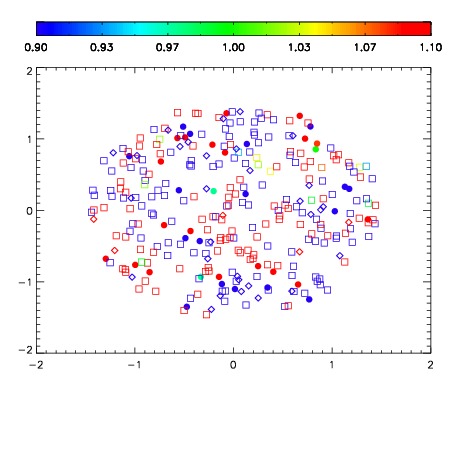
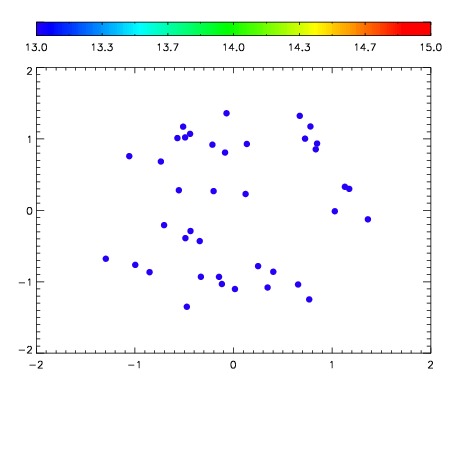

| Frame | Nreads | Zeropoints | Mag plots | Spatial mag deviation | Spatial sky 16325A emission deviations (filled: sky, open: star) | Spatial sky continuum emission | Spatial sky telluric CO2 absorption deviations (filled: H < 10) | |||||||||||||||||||||||
| 0 | 0 |
|
|
|
|
|
|
| IPAIR | NAME | SHIFT | NEWSHIFT | S/N | NAME | SHIFT | NEWSHIFT | S/N |
| 0 | 03120068 | 0.499295 | 0.00000 | 199.363 | 03120069 | 0.00510173 | 0.494193 | 201.397 |
| 1 | 03120064 | 0.493854 | 0.00544101 | 208.746 | 03120065 | 0.00277703 | 0.496518 | 211.930 |
| 2 | 03120063 | 0.493073 | 0.00622201 | 204.787 | 03120066 | 0.00121156 | 0.498083 | 208.368 |
| 3 | 03120067 | 0.497415 | 0.00187999 | 200.076 | 03120062 | 0.00000 | 0.499295 | 205.730 |