| Red | Green | Blue | |
| z | 17.64 | ||
| znorm | Inf | ||
| sky | -Inf | -Inf | -Inf |
| S/N | 27.5 | 47.0 | 52.3 |
| S/N(c) | 0.0 | 0.0 | 0.0 |
| SN(E/C) |
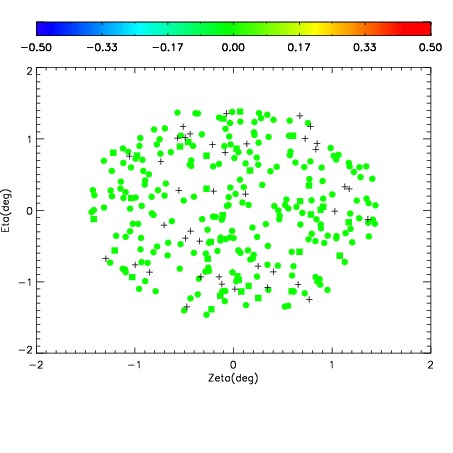
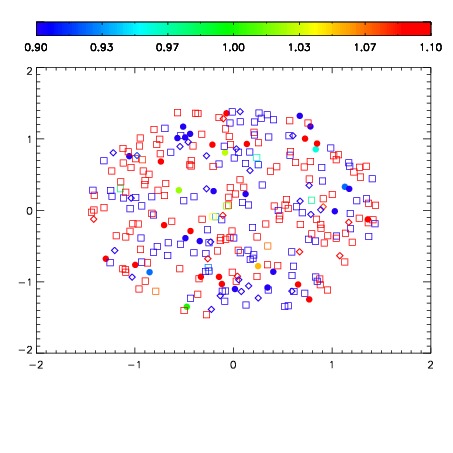
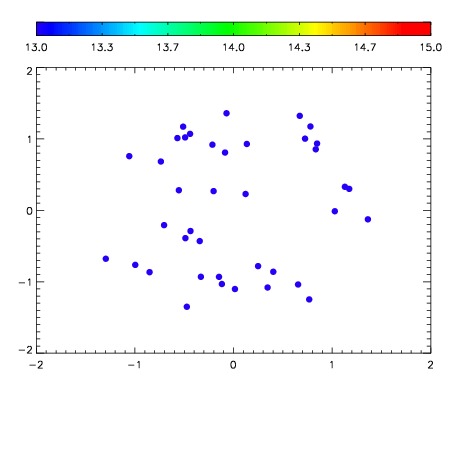

| Frame | Nreads | Zeropoints | Mag plots | Spatial mag deviation | Spatial sky 16325A emission deviations (filled: sky, open: star) | Spatial sky continuum emission | Spatial sky telluric CO2 absorption deviations (filled: H < 10) | |||||||||||||||||||||||
| 0 | 0 |
|
|
|
|
|
|
| IPAIR | NAME | SHIFT | NEWSHIFT | S/N | NAME | SHIFT | NEWSHIFT | S/N |
| 0 | 03440048 | 0.505316 | 0.00000 | 192.323 | 03440049 | 0.00168295 | 0.503633 | 194.573 |
| 1 | 03440047 | 0.503566 | 0.00174999 | 197.060 | 03440046 | 0.00000 | 0.505316 | 199.103 |
| 2 | 03440051 | 0.503680 | 0.00163603 | 193.513 | 03440050 | 0.00146730 | 0.503849 | 198.950 |
| 3 | 03440052 | 0.504506 | 0.000810027 | 189.881 | 03440053 | 0.00203252 | 0.503284 | 194.496 |