| Red | Green | Blue | |
| z | 17.64 | ||
| znorm | Inf | ||
| sky | -Inf | -Inf | -Inf |
| S/N | 29.8 | 52.0 | 55.3 |
| S/N(c) | 0.0 | 0.0 | 0.0 |
| SN(E/C) |
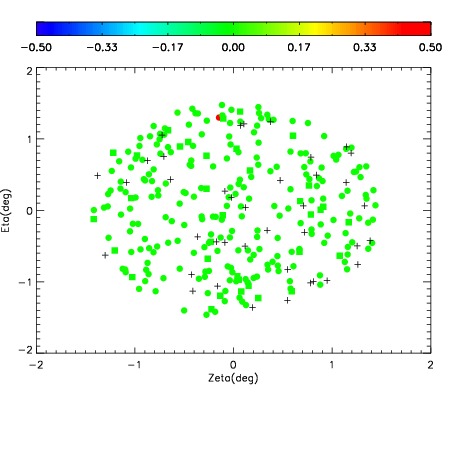
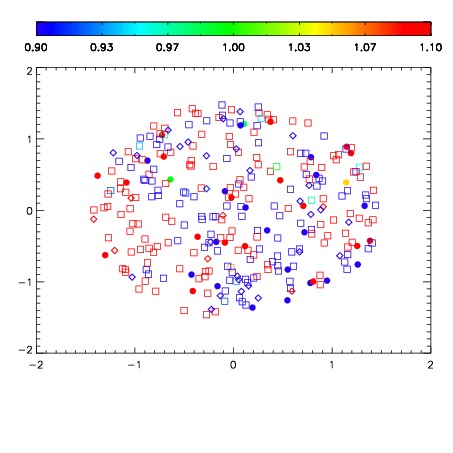
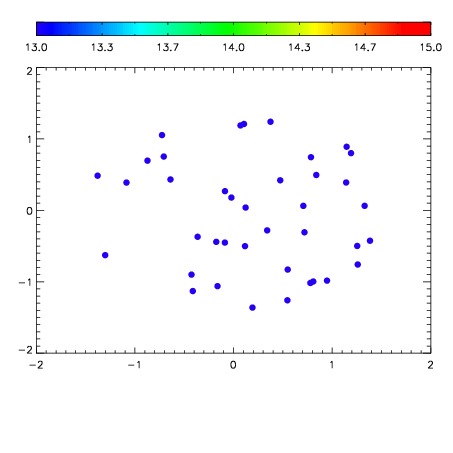

| Frame | Nreads | Zeropoints | Mag plots | Spatial mag deviation | Spatial sky 16325A emission deviations (filled: sky, open: star) | Spatial sky continuum emission | Spatial sky telluric CO2 absorption deviations (filled: H < 10) | |||||||||||||||||||||||
| 0 | 0 |
|
|
|
|
|
|
| IPAIR | NAME | SHIFT | NEWSHIFT | S/N | NAME | SHIFT | NEWSHIFT | S/N |
| 0 | 02930029 | 0.404702 | 0.00000 | 204.040 | 02930027 | 0.000361684 | 0.404340 | 207.558 |
| 1 | 02930024 | 0.402132 | 0.00257000 | 220.259 | 02930023 | 0.00000 | 0.404702 | 218.349 |
| 2 | 02930025 | 0.403540 | 0.00116202 | 218.098 | 02930026 | 0.00165619 | 0.403046 | 215.241 |
| 3 | 02930028 | 0.403397 | 0.00130501 | 207.806 | 02930030 | 0.00174813 | 0.402954 | 207.742 |