| Red | Green | Blue | |
| z | 17.64 | ||
| znorm | Inf | ||
| sky | -Inf | -Inf | -Inf |
| S/N | 27.9 | 47.1 | 52.0 |
| S/N(c) | 0.0 | 0.0 | 0.0 |
| SN(E/C) |
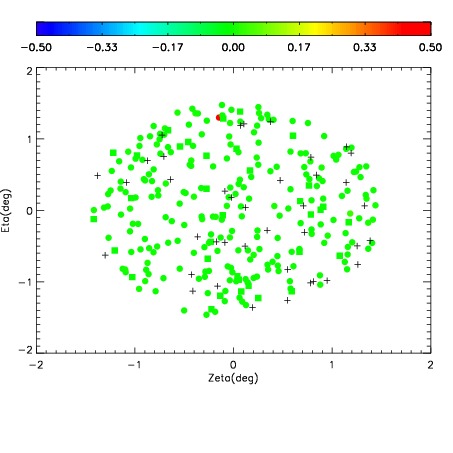
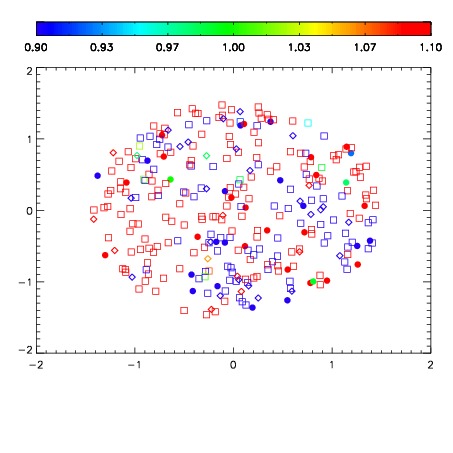
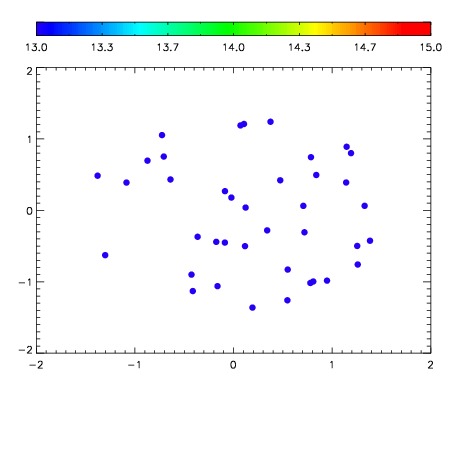

| Frame | Nreads | Zeropoints | Mag plots | Spatial mag deviation | Spatial sky 16325A emission deviations (filled: sky, open: star) | Spatial sky continuum emission | Spatial sky telluric CO2 absorption deviations (filled: H < 10) | |||||||||||||||||||||||
| 0 | 0 |
|
|
|
|
|
|
| IPAIR | NAME | SHIFT | NEWSHIFT | S/N | NAME | SHIFT | NEWSHIFT | S/N |
| 0 | 03690036 | 0.494167 | 0.00000 | 188.717 | 03690037 | -0.00141131 | 0.495578 | 193.821 |
| 1 | 03690039 | 0.492799 | 0.00136799 | 202.318 | 03690038 | -0.00227118 | 0.496438 | 201.908 |
| 2 | 03690040 | 0.493904 | 0.000263005 | 196.790 | 03690041 | -0.00164808 | 0.495815 | 201.736 |
| 3 | 03690035 | 0.492634 | 0.00153300 | 180.589 | 03690034 | 0.00000 | 0.494167 | 169.564 |