| Red | Green | Blue | |
| z | 17.64 | ||
| znorm | Inf | ||
| sky | -NaN | -Inf | -Inf |
| S/N | 30.6 | 48.9 | 56.2 |
| S/N(c) | 0.0 | 0.0 | 0.0 |
| SN(E/C) |
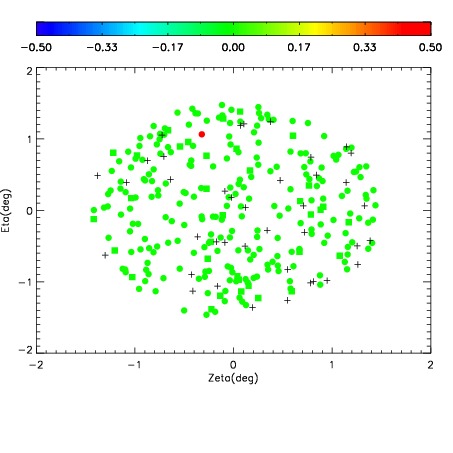
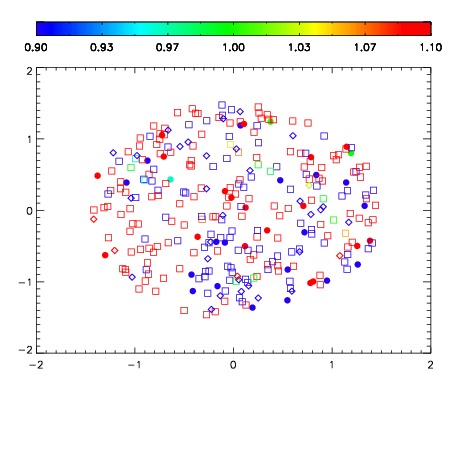
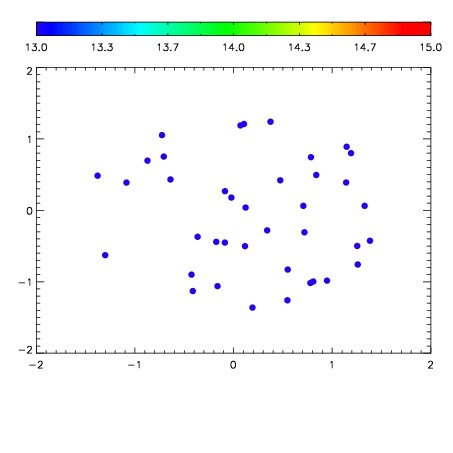

| Frame | Nreads | Zeropoints | Mag plots | Spatial mag deviation | Spatial sky 16325A emission deviations (filled: sky, open: star) | Spatial sky continuum emission | Spatial sky telluric CO2 absorption deviations (filled: H < 10) | |||||||||||||||||||||||
| 0 | 0 |
|
|
|
|
|
|
| IPAIR | NAME | SHIFT | NEWSHIFT | S/N | NAME | SHIFT | NEWSHIFT | S/N |
| 0 | 03940026 | 0.500194 | 0.00000 | 216.790 | 03940025 | 0.00000 | 0.500194 | 217.630 |
| 1 | 03940031 | 0.494278 | 0.00591600 | 223.767 | 03940032 | -0.00213261 | 0.502327 | 229.044 |
| 2 | 03940030 | 0.494419 | 0.00577500 | 222.356 | 03940029 | -0.000488435 | 0.500682 | 219.428 |
| 3 | 03940027 | 0.499537 | 0.000657022 | 207.495 | 03940028 | -0.000599472 | 0.500793 | 213.209 |