| Red | Green | Blue | |
| z | 17.64 | ||
| znorm | Inf | ||
| sky | -NaN | -NaN | -Inf |
| S/N | 29.7 | 49.8 | 55.3 |
| S/N(c) | 0.0 | 0.0 | 0.0 |
| SN(E/C) |
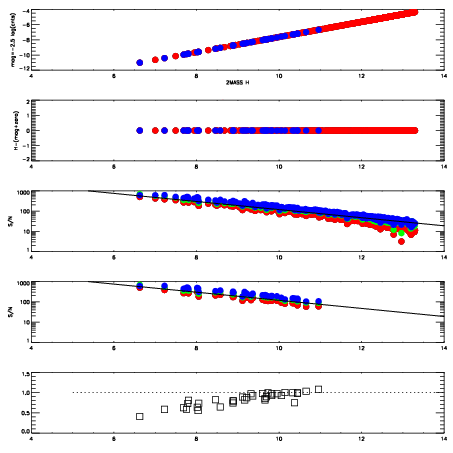
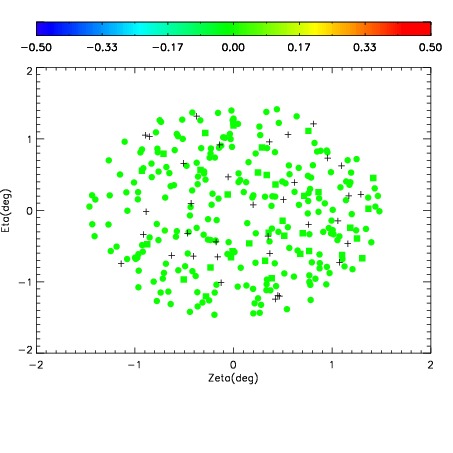
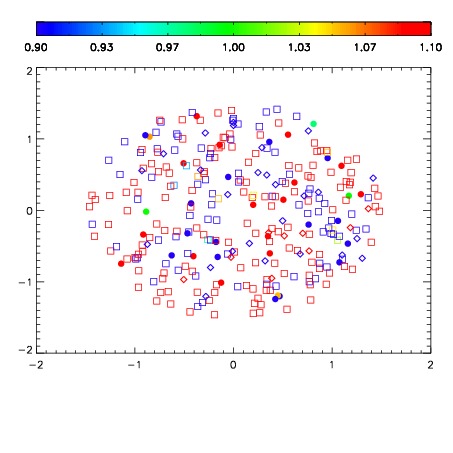
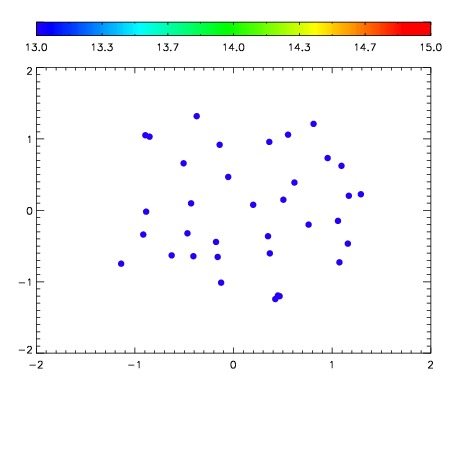

| Frame | Nreads | Zeropoints | Mag plots | Spatial mag deviation | Spatial sky 16325A emission deviations (filled: sky, open: star) | Spatial sky continuum emission | Spatial sky telluric CO2 absorption deviations (filled: H < 10) | |||||||||||||||||||||||
| 0 | 0 |
|
|
|
|
|
|
| IPAIR | NAME | SHIFT | NEWSHIFT | S/N | NAME | SHIFT | NEWSHIFT | S/N |
| 0 | 03200049 | 0.511576 | 0.00000 | 173.200 | 03200054 | 0.00471982 | 0.506856 | 179.251 |
| 1 | 03200052 | 0.508361 | 0.00321501 | 182.391 | 03200051 | 0.00211150 | 0.509465 | 180.795 |
| 2 | 03200053 | 0.509064 | 0.00251198 | 179.948 | 03200050 | 0.00177150 | 0.509804 | 179.495 |
| 3 | 03200048 | 0.501441 | 0.0101350 | 170.517 | 03200047 | 0.00000 | 0.511576 | 164.791 |