| Red | Green | Blue | |
| z | 17.64 | ||
| znorm | Inf | ||
| sky | -Inf | -Inf | -Inf |
| S/N | 30.8 | 52.3 | 54.6 |
| S/N(c) | 0.0 | 0.0 | 0.0 |
| SN(E/C) |
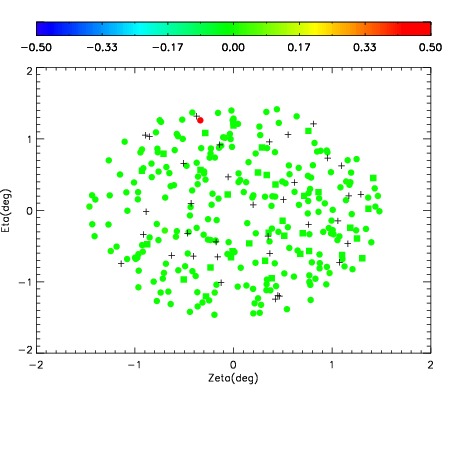
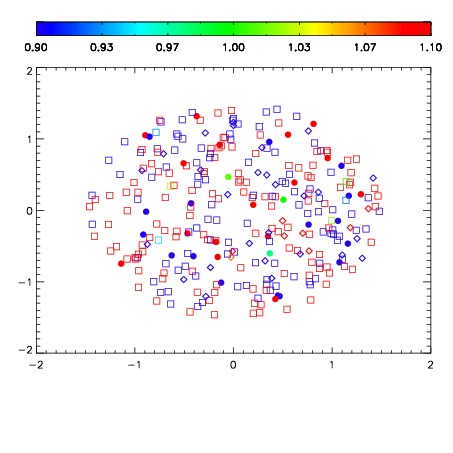


| Frame | Nreads | Zeropoints | Mag plots | Spatial mag deviation | Spatial sky 16325A emission deviations (filled: sky, open: star) | Spatial sky continuum emission | Spatial sky telluric CO2 absorption deviations (filled: H < 10) | |||||||||||||||||||||||
| 0 | 0 |
|
|
|
|
|
|
| IPAIR | NAME | SHIFT | NEWSHIFT | S/N | NAME | SHIFT | NEWSHIFT | S/N |
| 0 | 03670043 | 0.501603 | 0.00000 | 201.812 | 03670041 | 0.000736145 | 0.500867 | 201.758 |
| 1 | 03670042 | 0.499079 | 0.00252402 | 202.621 | 03670044 | 0.00304029 | 0.498563 | 202.146 |
| 2 | 03670039 | 0.499014 | 0.00258902 | 201.758 | 03670040 | 0.00134982 | 0.500253 | 198.015 |
| 3 | 03670038 | 0.497785 | 0.00381801 | 199.730 | 03670037 | 0.00000 | 0.501603 | 194.260 |