| Red | Green | Blue | |
| z | 17.64 | ||
| znorm | Inf | ||
| sky | -Inf | -Inf | -Inf |
| S/N | 17.1 | 31.3 | 32.8 |
| S/N(c) | 0.0 | 0.0 | 0.0 |
| SN(E/C) |
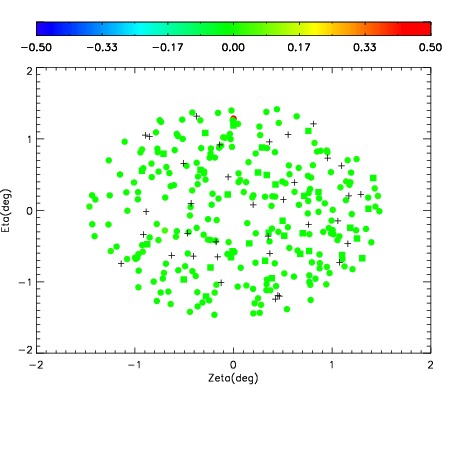

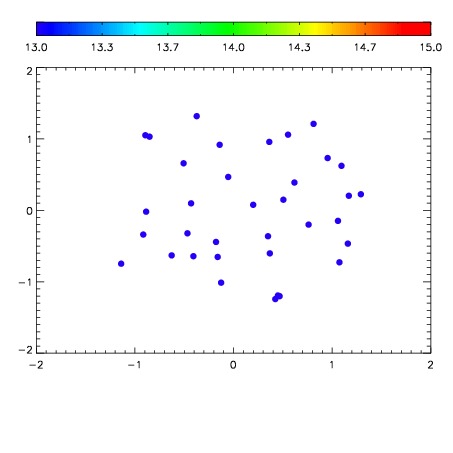

| Frame | Nreads | Zeropoints | Mag plots | Spatial mag deviation | Spatial sky 16325A emission deviations (filled: sky, open: star) | Spatial sky continuum emission | Spatial sky telluric CO2 absorption deviations (filled: H < 10) | |||||||||||||||||||||||
| 0 | 0 |
|
|
|
|
|
|
| IPAIR | NAME | SHIFT | NEWSHIFT | S/N | NAME | SHIFT | NEWSHIFT | S/N |
| 0 | 03770016 | 0.512660 | 0.00000 | 119.713 | 03770017 | 0.00536847 | 0.507292 | 152.072 |
| 1 | 03770012 | 0.511829 | 0.000831008 | 132.733 | 03770013 | 0.00322344 | 0.509437 | 166.535 |
| 2 | 03770011 | 0.510547 | 0.00211304 | 124.973 | 03770014 | 0.00363956 | 0.509020 | 161.145 |
| 3 | 03770015 | 0.511513 | 0.00114703 | 104.222 | 03770010 | 0.00000 | 0.512660 | 116.237 |