| Red | Green | Blue | |
| z | 17.64 | ||
| znorm | Inf | ||
| sky | -Inf | -NaN | -Inf |
| S/N | 23.2 | 37.9 | 39.9 |
| S/N(c) | 0.0 | 0.0 | 0.0 |
| SN(E/C) |
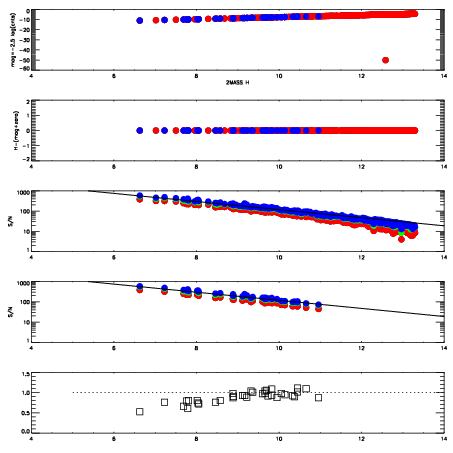
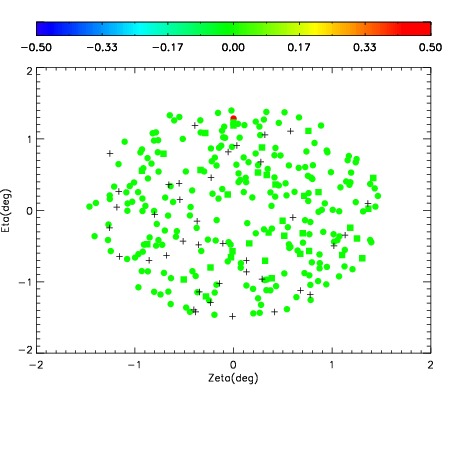
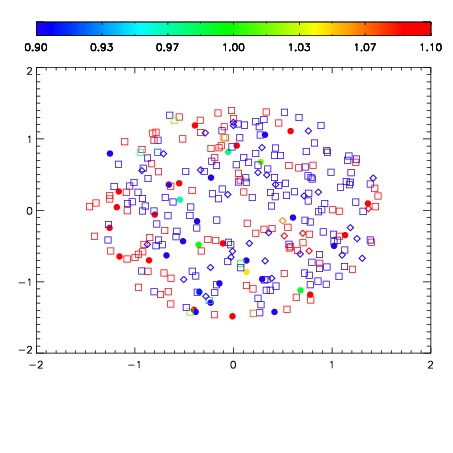
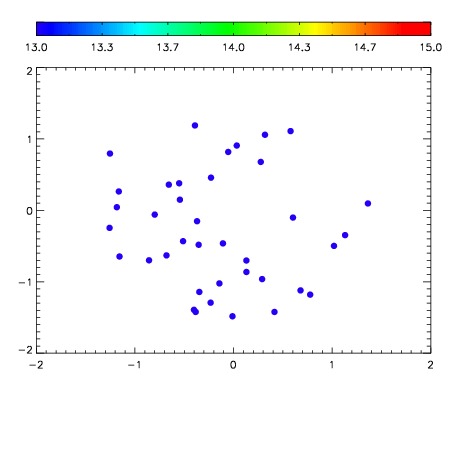

| Frame | Nreads | Zeropoints | Mag plots | Spatial mag deviation | Spatial sky 16325A emission deviations (filled: sky, open: star) | Spatial sky continuum emission | Spatial sky telluric CO2 absorption deviations (filled: H < 10) | |||||||||||||||||||||||
| 0 | 0 |
|
|
|
|
|
|
| IPAIR | NAME | SHIFT | NEWSHIFT | S/N | NAME | SHIFT | NEWSHIFT | S/N |
| 0 | 04030018 | 0.505300 | 0.00000 | 206.384 | 04030015 | 0.00110838 | 0.504192 | 239.438 |
| 1 | 04030017 | 0.503999 | 0.00130099 | 245.795 | 04030019 | 0.00513460 | 0.500165 | 244.637 |
| 2 | 04030013 | 0.502556 | 0.00274396 | 173.610 | 04030016 | 0.00182521 | 0.503475 | 236.480 |
| 3 | 04030014 | 0.504548 | 0.000751972 | 70.1271 | 04030012 | 0.00000 | 0.505300 | 165.911 |