| Red | Green | Blue | |
| z | 17.64 | ||
| znorm | Inf | ||
| sky | -Inf | -Inf | -Inf |
| S/N | 27.7 | 45.9 | 50.3 |
| S/N(c) | 0.0 | 0.0 | 0.0 |
| SN(E/C) |
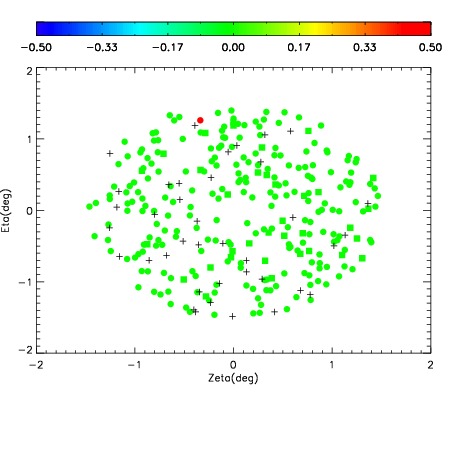
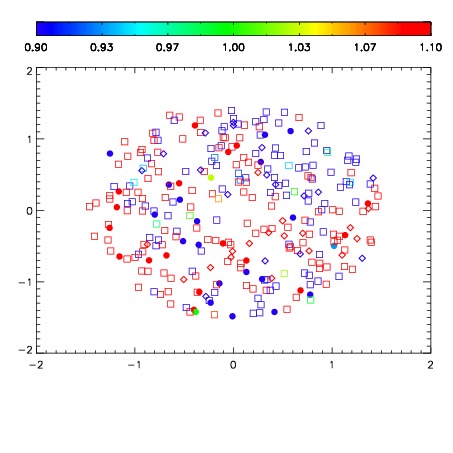
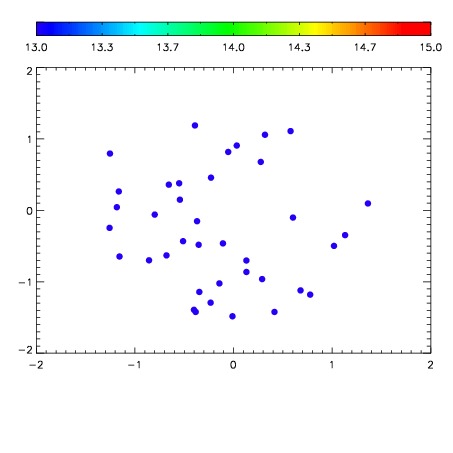

| Frame | Nreads | Zeropoints | Mag plots | Spatial mag deviation | Spatial sky 16325A emission deviations (filled: sky, open: star) | Spatial sky continuum emission | Spatial sky telluric CO2 absorption deviations (filled: H < 10) | |||||||||||||||||||||||
| 0 | 0 |
|
|
|
|
|
|
| IPAIR | NAME | SHIFT | NEWSHIFT | S/N | NAME | SHIFT | NEWSHIFT | S/N |
| 0 | 06700080 | 0.475899 | 0.00000 | 245.872 | 06700078 | 0.00418383 | 0.471715 | 243.957 |
| 1 | 06700079 | 0.475148 | 0.000751019 | 249.028 | 06700074 | 0.00000 | 0.475899 | 244.021 |
| 2 | 06700075 | 0.474357 | 0.00154200 | 240.975 | 06700077 | 0.00169983 | 0.474199 | 240.966 |
| 3 | 06700076 | 0.475472 | 0.000427008 | 239.373 | 06700081 | 0.00403661 | 0.471862 | 240.632 |