| Red | Green | Blue | |
| z | 17.64 | ||
| znorm | Inf | ||
| sky | -Inf | -Inf | -Inf |
| S/N | 20.4 | 38.0 | 39.9 |
| S/N(c) | 0.0 | 0.0 | 0.0 |
| SN(E/C) |
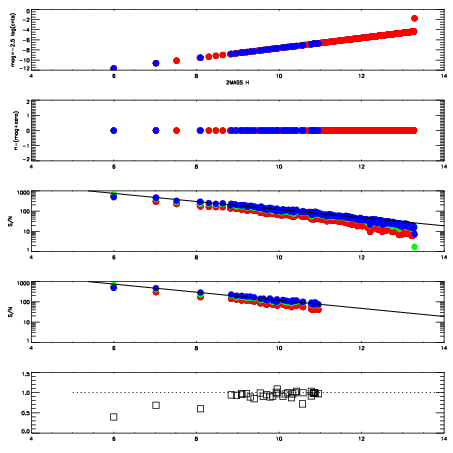
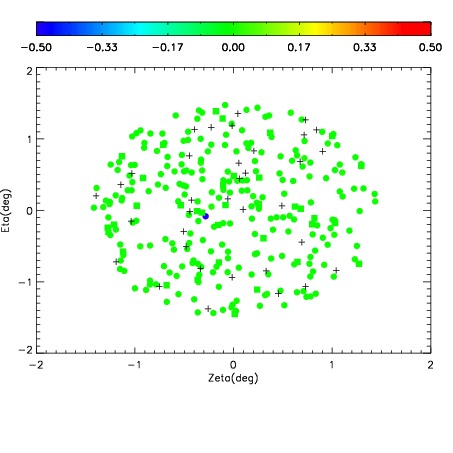
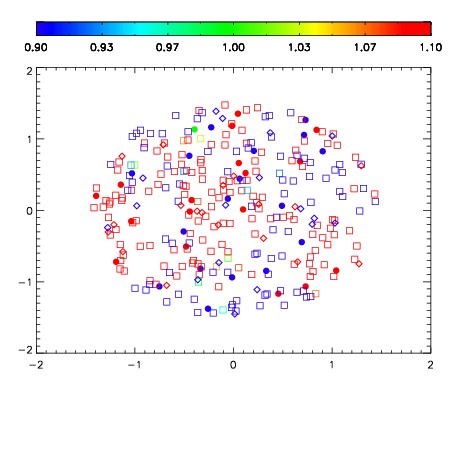
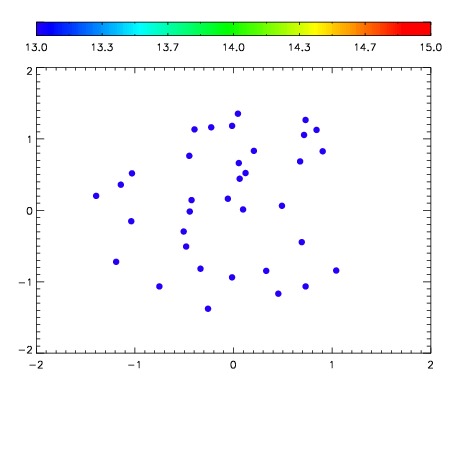

| Frame | Nreads | Zeropoints | Mag plots | Spatial mag deviation | Spatial sky 16325A emission deviations (filled: sky, open: star) | Spatial sky continuum emission | Spatial sky telluric CO2 absorption deviations (filled: H < 10) | |||||||||||||||||||||||
| 0 | 0 |
|
|
|
|
|
|
| IPAIR | NAME | SHIFT | NEWSHIFT | S/N | NAME | SHIFT | NEWSHIFT | S/N |
| 0 | 04050016 | 0.502338 | 0.00000 | 128.849 | 04050017 | 0.00207180 | 0.500266 | 140.187 |
| 1 | 04050012 | 0.501865 | 0.000472963 | 154.560 | 04050013 | 0.00128071 | 0.501057 | 148.946 |
| 2 | 04050011 | 0.500054 | 0.00228399 | 143.631 | 04050010 | 0.00000 | 0.502338 | 145.073 |
| 3 | 04050015 | 0.500137 | 0.00220102 | 136.567 | 04050014 | 0.000526510 | 0.501812 | 141.818 |