| Red | Green | Blue | |
| z | 17.64 | ||
| znorm | Inf | ||
| sky | -Inf | -NaN | -Inf |
| S/N | 25.7 | 43.4 | 50.7 |
| S/N(c) | 0.0 | 0.0 | 0.0 |
| SN(E/C) |
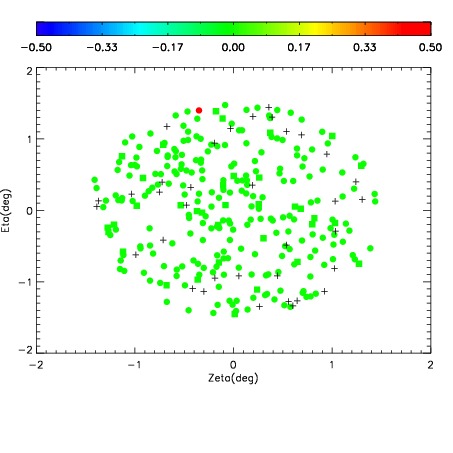
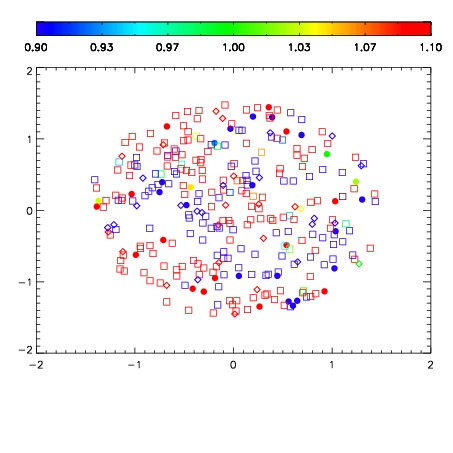


| Frame | Nreads | Zeropoints | Mag plots | Spatial mag deviation | Spatial sky 16325A emission deviations (filled: sky, open: star) | Spatial sky continuum emission | Spatial sky telluric CO2 absorption deviations (filled: H < 10) | |||||||||||||||||||||||
| 0 | 0 |
|
|
|
|
|
|
| IPAIR | NAME | SHIFT | NEWSHIFT | S/N | NAME | SHIFT | NEWSHIFT | S/N |
| 0 | 06430071 | 0.480304 | 0.00000 | 245.079 | 06430072 | 0.000640286 | 0.479664 | 247.534 |
| 1 | 06430070 | 0.479674 | 0.000629991 | 252.432 | 06430069 | 0.00000 | 0.480304 | 255.520 |
| 2 | 06430075 | 0.478945 | 0.00135902 | 232.658 | 06430073 | 0.000936224 | 0.479368 | 244.146 |
| 3 | 06430074 | 0.479242 | 0.00106201 | 229.972 | 06430076 | -0.000681877 | 0.480986 | 219.850 |