| Red | Green | Blue | |
| z | 17.64 | ||
| znorm | Inf | ||
| sky | -Inf | -NaN | -Inf |
| S/N | 21.1 | 38.7 | 40.7 |
| S/N(c) | 0.0 | 0.0 | 0.0 |
| SN(E/C) |


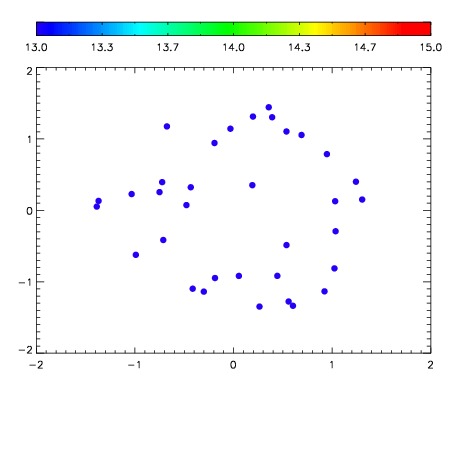

| Frame | Nreads | Zeropoints | Mag plots | Spatial mag deviation | Spatial sky 16325A emission deviations (filled: sky, open: star) | Spatial sky continuum emission | Spatial sky telluric CO2 absorption deviations (filled: H < 10) | |||||||||||||||||||||||
| 0 | 0 |
|
|
|
|
|
|
| IPAIR | NAME | SHIFT | NEWSHIFT | S/N | NAME | SHIFT | NEWSHIFT | S/N |
| 0 | 06770012 | 0.492337 | 0.00000 | 239.830 | 06770013 | 0.00216920 | 0.490168 | 241.358 |
| 1 | 06770011 | 0.492170 | 0.000166982 | 219.383 | 06770010 | 0.00000 | 0.492337 | 237.990 |
| 2 | 06770015 | 0.491287 | 0.00105000 | 206.659 | 06770014 | 0.00301082 | 0.489326 | 231.910 |
| 3 | 06770016 | 0.492179 | 0.000157982 | 196.139 | 06770017 | 0.00674998 | 0.485587 | 183.840 |