| Red | Green | Blue | |
| z | 17.65 | ||
| znorm | Inf | ||
| sky | -NaN | -Inf | -Inf |
| S/N | 6.5 | 11.1 | 12.6 |
| S/N(c) | 0.0 | 0.0 | 0.0 |
| SN(E/C) |
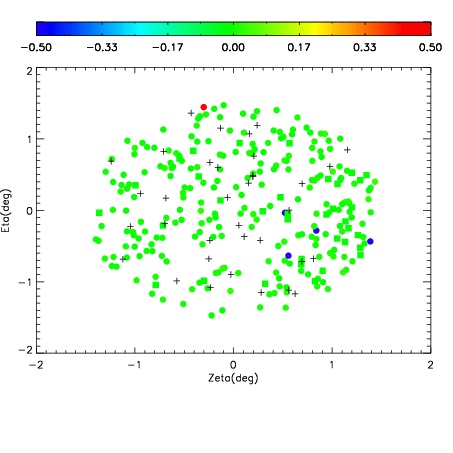
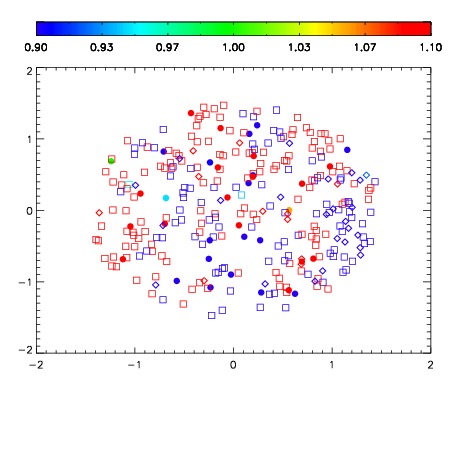
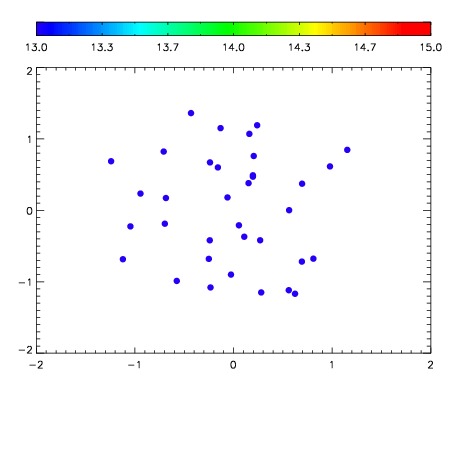

| Frame | Nreads | Zeropoints | Mag plots | Spatial mag deviation | Spatial sky 16325A emission deviations (filled: sky, open: star) | Spatial sky continuum emission | Spatial sky telluric CO2 absorption deviations (filled: H < 10) | |||||||||||||||||||||||
| 0 | 0 |
|
|
|
|
|
|
| IPAIR | NAME | SHIFT | NEWSHIFT | S/N | NAME | SHIFT | NEWSHIFT | S/N |
| 0 | 03140064 | 0.511524 | 0.00000 | 101.000 | 03140062 | 0.00000 | 0.511524 | 94.9214 |
| 1 | 03140063 | 0.510375 | 0.00114900 | 89.8567 | 03140065 | 0.000878130 | 0.510646 | 94.2910 |
| 2 | 03140068 | 0.510558 | 0.000966012 | 82.7549 | 03140069 | -0.00167178 | 0.513196 | 89.4628 |
| 3 | 03140067 | 0.509230 | 0.00229400 | 60.9129 | 03140066 | -0.00102023 | 0.512544 | 77.8814 |