| Red | Green | Blue | |
| z | 17.64 | ||
| znorm | Inf | ||
| sky | -Inf | -Inf | -Inf |
| S/N | 27.6 | 47.4 | 50.3 |
| S/N(c) | 0.0 | 0.0 | 0.0 |
| SN(E/C) |

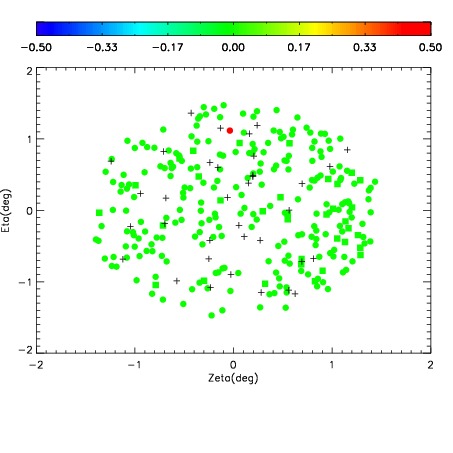
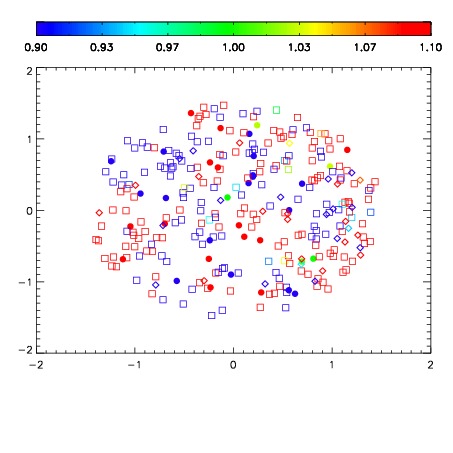
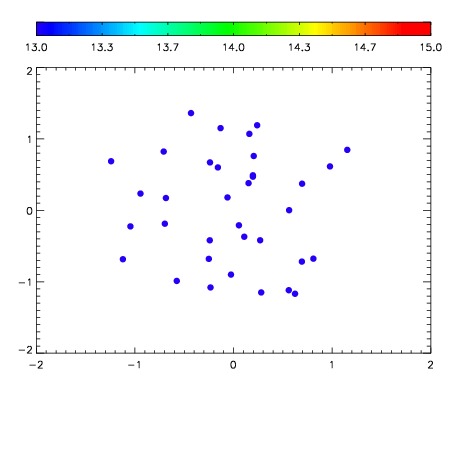

| Frame | Nreads | Zeropoints | Mag plots | Spatial mag deviation | Spatial sky 16325A emission deviations (filled: sky, open: star) | Spatial sky continuum emission | Spatial sky telluric CO2 absorption deviations (filled: H < 10) | |||||||||||||||||||||||
| 0 | 0 |
|
|
|
|
|
|
| IPAIR | NAME | SHIFT | NEWSHIFT | S/N | NAME | SHIFT | NEWSHIFT | S/N |
| 0 | 04290010 | 0.498198 | 0.00000 | 204.965 | 04290008 | 0.00000 | 0.498198 | 194.889 |
| 1 | 04290013 | 0.494867 | 0.00333101 | 221.472 | 04290015 | 0.00153824 | 0.496660 | 217.150 |
| 2 | 04290014 | 0.495877 | 0.00232100 | 221.281 | 04290012 | 4.33454e-05 | 0.498155 | 215.904 |
| 3 | 04290009 | 0.495114 | 0.00308400 | 204.974 | 04290011 | 0.000548228 | 0.497650 | 208.505 |