| Red | Green | Blue | |
| z | 17.64 | ||
| znorm | Inf | ||
| sky | -Inf | -NaN | -Inf |
| S/N | 32.9 | 55.2 | 58.4 |
| S/N(c) | 0.0 | 0.0 | 0.0 |
| SN(E/C) |
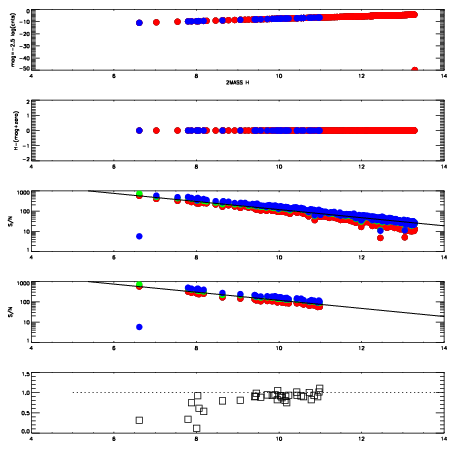
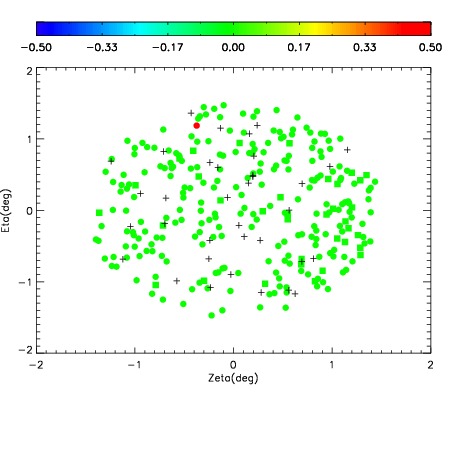
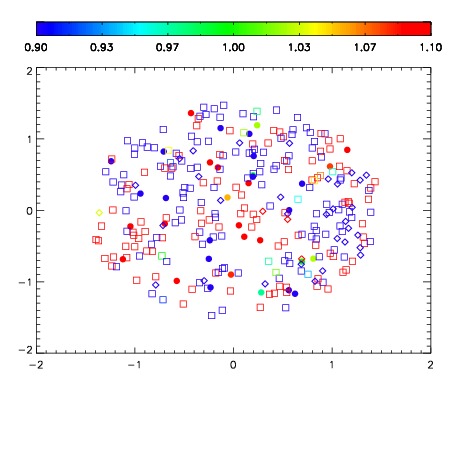
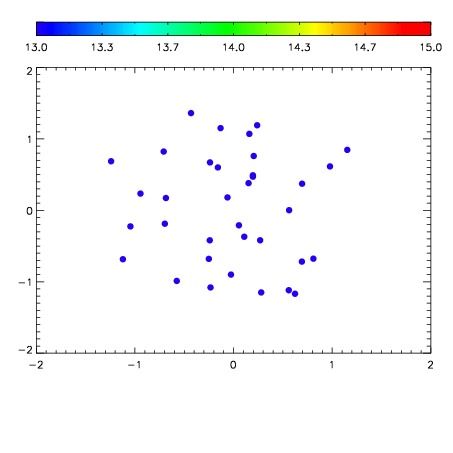

| Frame | Nreads | Zeropoints | Mag plots | Spatial mag deviation | Spatial sky 16325A emission deviations (filled: sky, open: star) | Spatial sky continuum emission | Spatial sky telluric CO2 absorption deviations (filled: H < 10) | |||||||||||||||||||||||
| 0 | 0 |
|
|
|
|
|
|
| IPAIR | NAME | SHIFT | NEWSHIFT | S/N | NAME | SHIFT | NEWSHIFT | S/N |
| 0 | 06280017 | 0.483087 | 0.00000 | 216.571 | 06280015 | -0.00152158 | 0.484609 | 212.793 |
| 1 | 06280018 | 0.483076 | 1.09971e-05 | 219.911 | 06280019 | 0.00922147 | 0.473866 | 220.284 |
| 2 | 06280014 | 0.479678 | 0.00340900 | 217.867 | 06280016 | -0.00284565 | 0.485933 | 217.323 |
| 3 | 06280013 | 0.479996 | 0.00309101 | 216.563 | 06280012 | 0.00000 | 0.483087 | 209.105 |