| Red | Green | Blue | |
| z | 17.64 | ||
| znorm | Inf | ||
| sky | -Inf | -Inf | -Inf |
| S/N | 22.4 | 38.0 | 44.3 |
| S/N(c) | 0.0 | 0.0 | 0.0 |
| SN(E/C) |
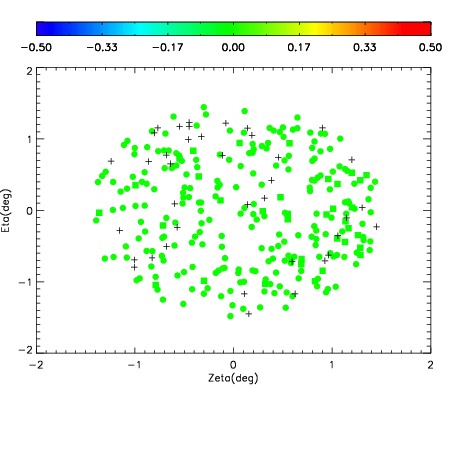
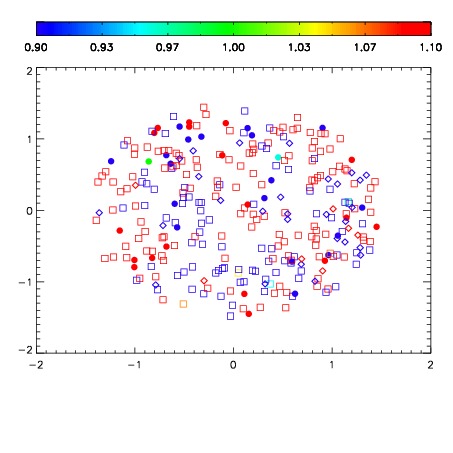
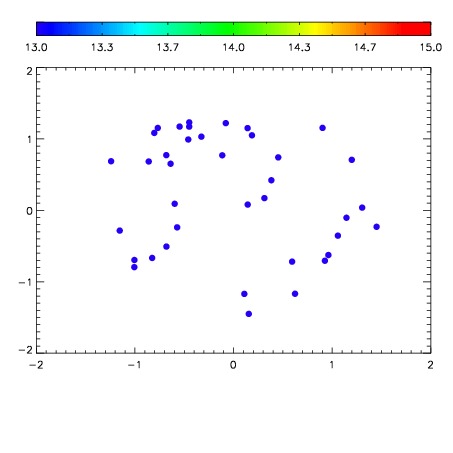

| Frame | Nreads | Zeropoints | Mag plots | Spatial mag deviation | Spatial sky 16325A emission deviations (filled: sky, open: star) | Spatial sky continuum emission | Spatial sky telluric CO2 absorption deviations (filled: H < 10) | |||||||||||||||||||||||
| 0 | 0 |
|
|
|
|
|
|
| IPAIR | NAME | SHIFT | NEWSHIFT | S/N | NAME | SHIFT | NEWSHIFT | S/N |
| 0 | 03420053 | 0.503984 | 0.00000 | 203.851 | 03420054 | -0.00178195 | 0.505766 | 218.523 |
| 1 | 03420049 | 0.501452 | 0.00253195 | 198.696 | 03420050 | 0.000313114 | 0.503671 | 201.848 |
| 2 | 03420052 | 0.498961 | 0.00502297 | 196.539 | 03420051 | -0.00126883 | 0.505253 | 193.189 |
| 3 | 03420048 | 0.497963 | 0.00602096 | 169.784 | 03420047 | 0.00000 | 0.503984 | 174.220 |