| Red | Green | Blue | |
| z | 17.64 | ||
| znorm | Inf | ||
| sky | -Inf | -Inf | -Inf |
| S/N | 27.7 | 48.5 | 52.7 |
| S/N(c) | 0.0 | 0.0 | 0.0 |
| SN(E/C) |
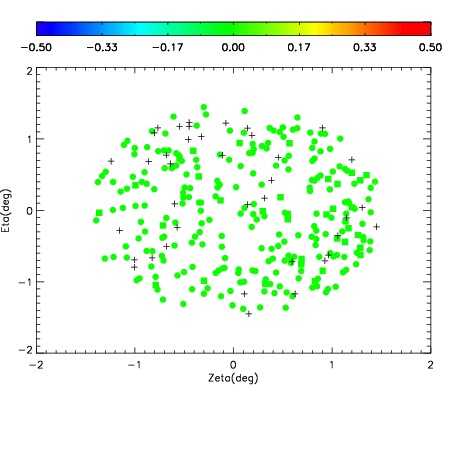
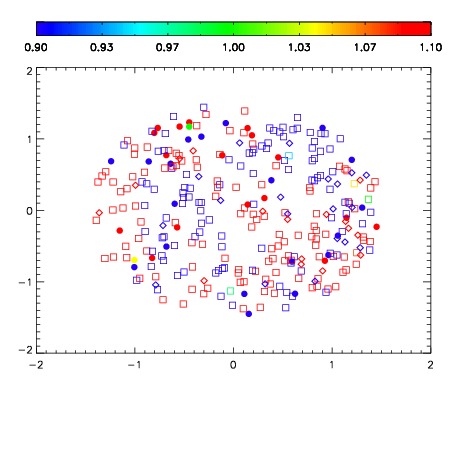
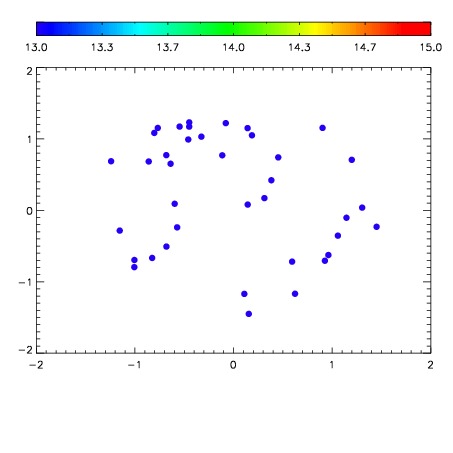

| Frame | Nreads | Zeropoints | Mag plots | Spatial mag deviation | Spatial sky 16325A emission deviations (filled: sky, open: star) | Spatial sky continuum emission | Spatial sky telluric CO2 absorption deviations (filled: H < 10) | |||||||||||||||||||||||
| 0 | 0 |
|
|
|
|
|
|
| IPAIR | NAME | SHIFT | NEWSHIFT | S/N | NAME | SHIFT | NEWSHIFT | S/N |
| 0 | 06700065 | 0.484189 | 0.00000 | 247.670 | 06700066 | -0.000255223 | 0.484444 | 247.354 |
| 1 | 06700069 | 0.477735 | 0.00645399 | 249.202 | 06700070 | 0.00258305 | 0.481606 | 251.463 |
| 2 | 06700064 | 0.483421 | 0.000768006 | 247.947 | 06700067 | -0.000474169 | 0.484663 | 250.899 |
| 3 | 06700068 | 0.477004 | 0.00718501 | 247.889 | 06700063 | 0.00000 | 0.484189 | 248.108 |