| Red | Green | Blue | |
| z | 17.64 | ||
| znorm | Inf | ||
| sky | -Inf | -Inf | -Inf |
| S/N | 29.1 | 52.0 | 53.9 |
| S/N(c) | 0.0 | 0.0 | 0.0 |
| SN(E/C) |
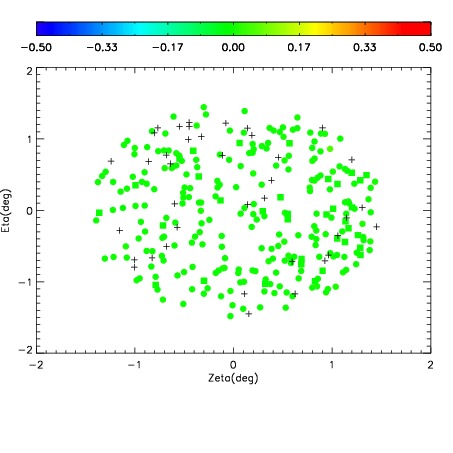
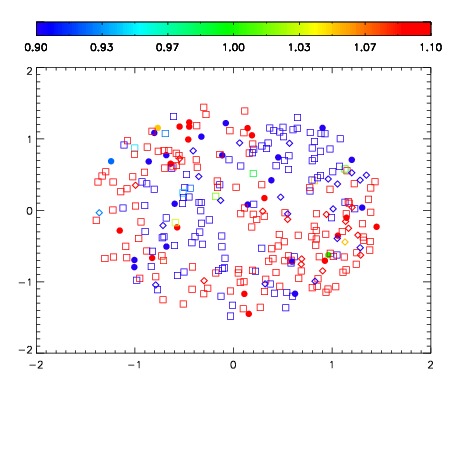
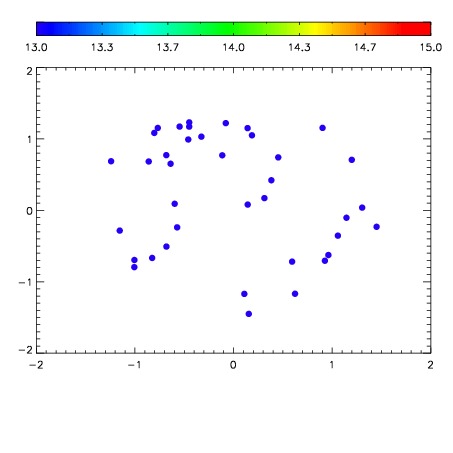

| Frame | Nreads | Zeropoints | Mag plots | Spatial mag deviation | Spatial sky 16325A emission deviations (filled: sky, open: star) | Spatial sky continuum emission | Spatial sky telluric CO2 absorption deviations (filled: H < 10) | |||||||||||||||||||||||
| 0 | 0 |
|
|
|
|
|
|
| IPAIR | NAME | SHIFT | NEWSHIFT | S/N | NAME | SHIFT | NEWSHIFT | S/N |
| 0 | 06760012 | 0.493168 | 0.00000 | 241.467 | 06760013 | 0.00222104 | 0.490947 | 242.881 |
| 1 | 06760016 | 0.492169 | 0.000999004 | 240.967 | 06760014 | 0.00254732 | 0.490621 | 241.776 |
| 2 | 06760015 | 0.491523 | 0.00164500 | 240.379 | 06760017 | 0.00437527 | 0.488793 | 239.814 |
| 3 | 06760011 | 0.492908 | 0.000259995 | 239.755 | 06760010 | 0.00000 | 0.493168 | 235.210 |