| Red | Green | Blue | |
| z | 17.64 | ||
| znorm | Inf | ||
| sky | -Inf | -Inf | -Inf |
| S/N | 24.9 | 43.1 | 46.4 |
| S/N(c) | 0.0 | 0.0 | 0.0 |
| SN(E/C) |
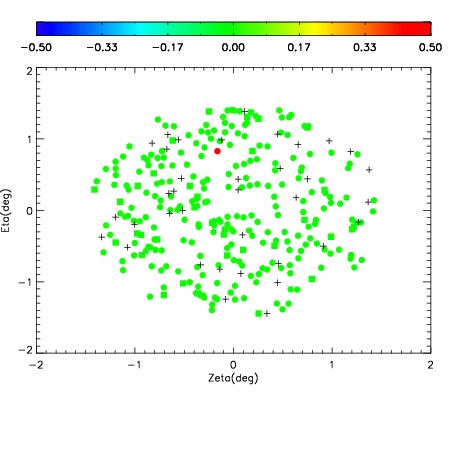
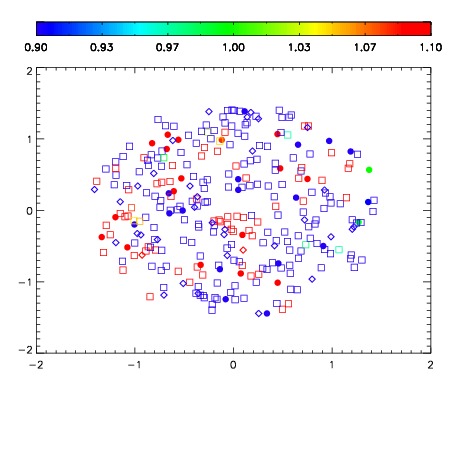
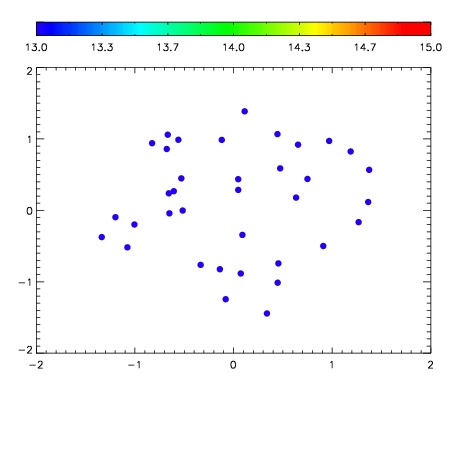

| Frame | Nreads | Zeropoints | Mag plots | Spatial mag deviation | Spatial sky 16325A emission deviations (filled: sky, open: star) | Spatial sky continuum emission | Spatial sky telluric CO2 absorption deviations (filled: H < 10) | |||||||||||||||||||||||
| 0 | 0 |
|
|
|
|
|
|
| IPAIR | NAME | SHIFT | NEWSHIFT | S/N | NAME | SHIFT | NEWSHIFT | S/N |
| 0 | 02870092 | 0.413926 | 0.00000 | 188.342 | 02870093 | -0.000552521 | 0.414479 | 178.084 |
| 1 | 02870091 | 0.412947 | 0.000979006 | 185.623 | 02870090 | -0.000732719 | 0.414659 | 176.460 |
| 2 | 02870088 | 0.412778 | 0.00114802 | 184.049 | 02870086 | 0.00000 | 0.413926 | 170.635 |
| 3 | 02870087 | 0.411998 | 0.00192800 | 175.014 | 02870089 | 0.000980427 | 0.412946 | 166.960 |