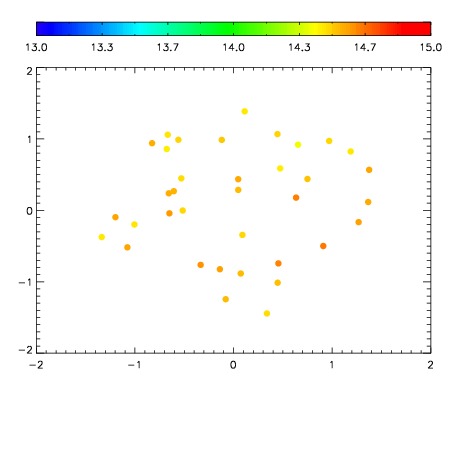
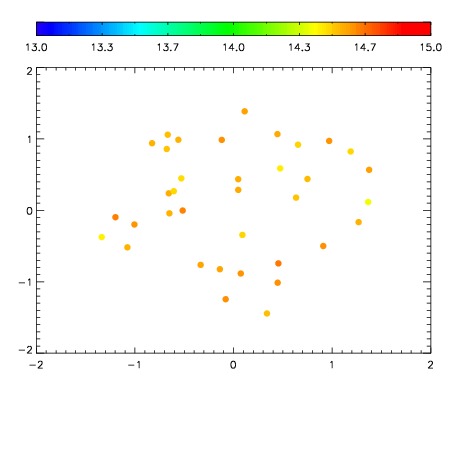
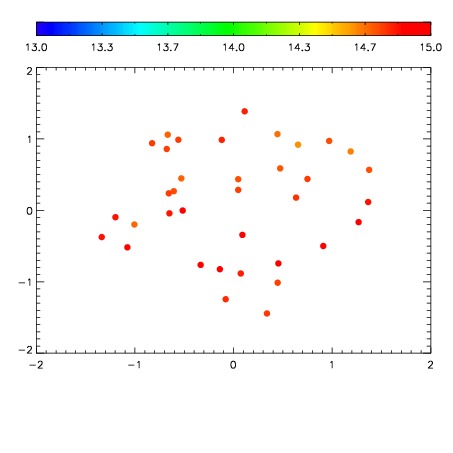
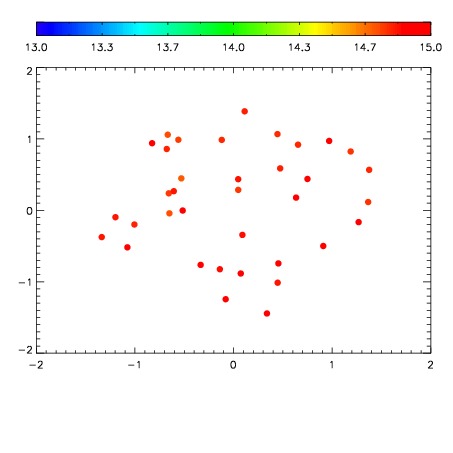
| Frame | Nreads | Zeropoints | Mag plots
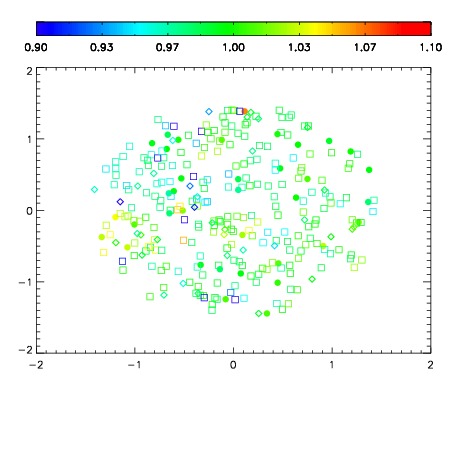
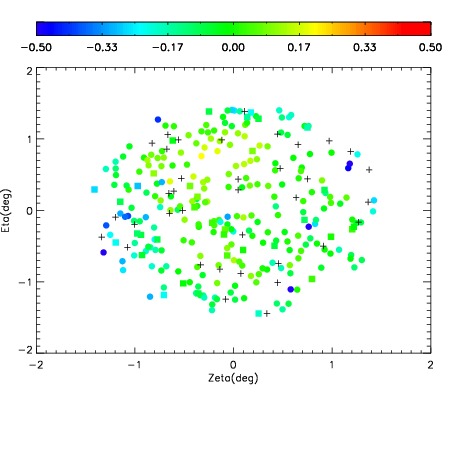
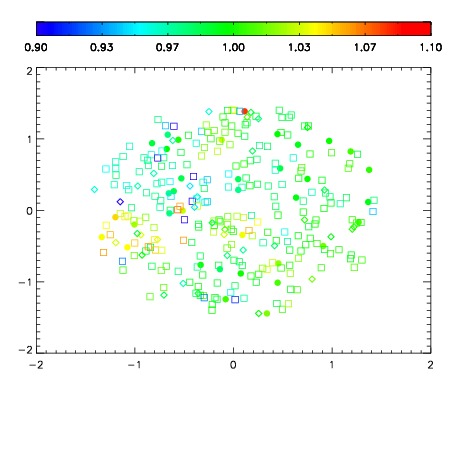
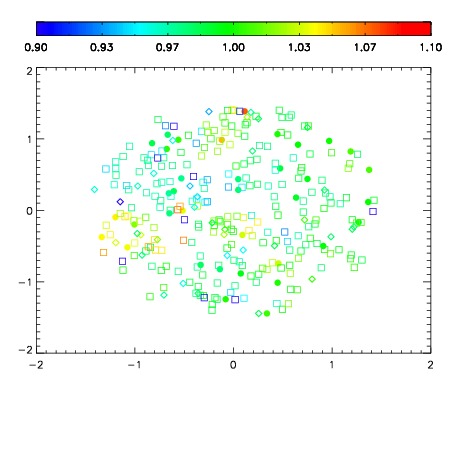
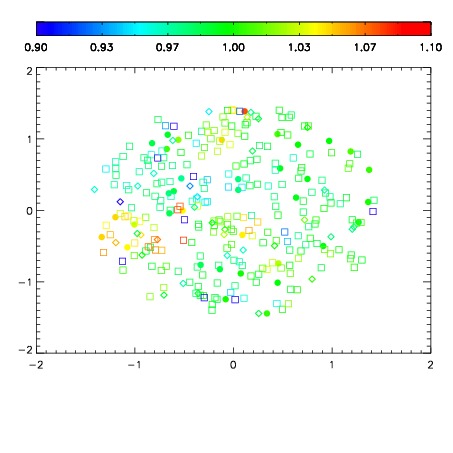
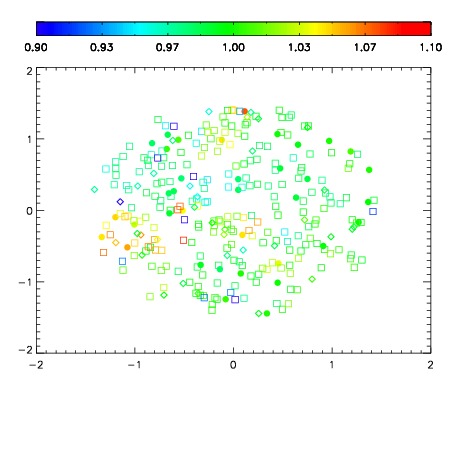
| Spatial mag deviation
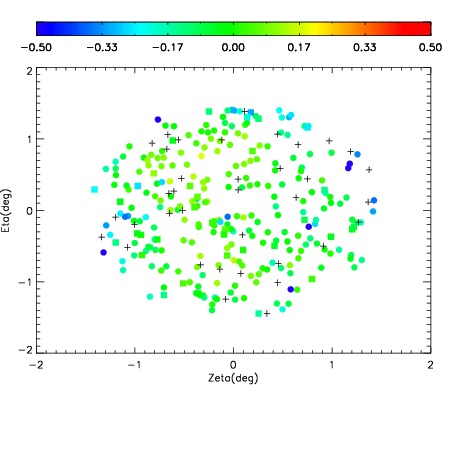
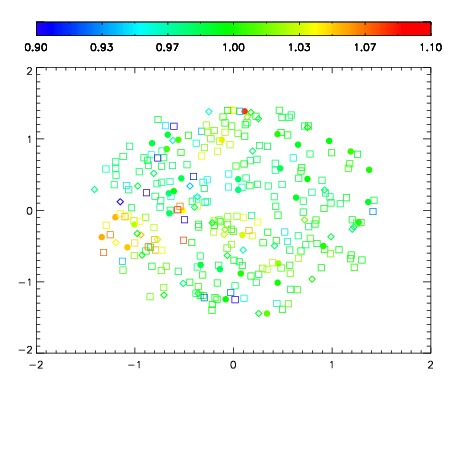
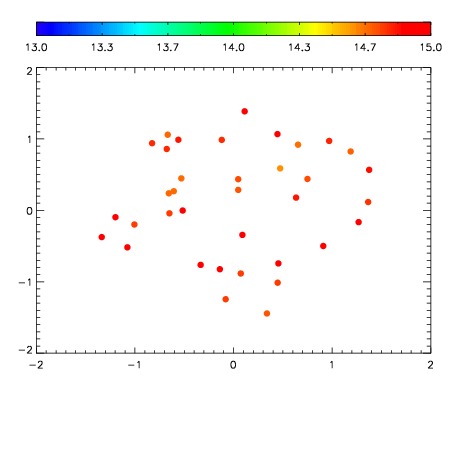
| Spatial sky 16325A emission deviations (filled: sky, open: star)
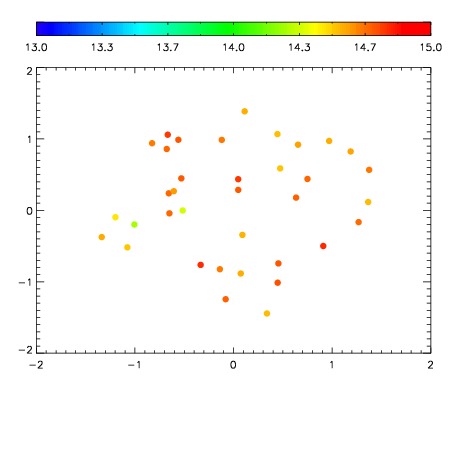
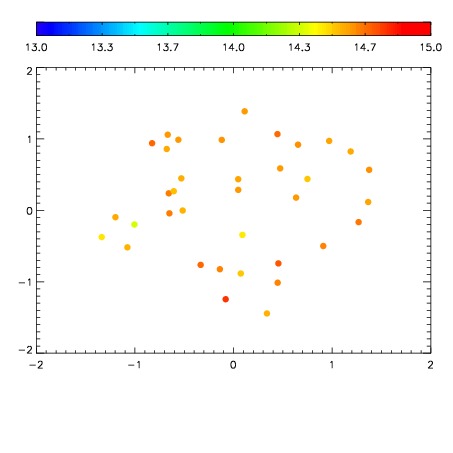
| Spatial sky continuum emission
| Spatial sky telluric CO2 absorption deviations (filled: H < 10)
|
| 3650047
| 47
| | Red | Green | Blue
| | z | | 18.49
| | znorm | | 14.31
| | sky | 15.1 | 14.7 | 14.7
| | S/N | 10.4 | 17.9 | 19.9
| | S/N(c) | 9.0 | 16.5 | 18.4
| | SN(E/C) 0.97
|
| 
| 
| 
| 
| 
|
| 3650048
| 47
| | Red | Green | Blue
| | z | | 18.40
| | znorm | | 14.22
| | sky | 14.7 | 14.5 | 15.0
| | S/N | 9.9 | 17.2 | 19.7
| | S/N(c) | 8.6 | 15.8 | 18.2
| | SN(E/C) 0.96
|
| 
| 
| 
| 
| 
|
| 3650049
| 47
| | Red | Green | Blue
| | z | | 18.30
| | znorm | | 14.12
| | sky | 14.7 | 14.6 | 15.0
| | S/N | 9.0 | 16.2 | 18.2
| | S/N(c) | 7.6 | 14.7 | 16.6
| | SN(E/C) 1.00
|
| 
| 
| 
| 
| 
|
| 3650050
| 47
| | Red | Green | Blue
| | z | | 18.17
| | znorm | | 13.99
| | sky | 14.6 | 14.5 | 14.9
| | S/N | 8.3 | 14.7 | 17.1
| | S/N(c) | 7.0 | 13.6 | 15.6
| | SN(E/C) 0.93
|
| 
| 
| 
| 
| 
|
| 3650051
| 47
| | Red | Green | Blue
| | z | | 18.24
| | znorm | | 14.06
| | sky | 14.8 | 14.6 | 15.0
| | S/N | 8.8 | 15.7 | 17.2
| | S/N(c) | 7.6 | 14.2 | 15.9
| | SN(E/C) 0.97
|
| 
| 
| 
| 
| 
|
| 3650052
| 47
| | Red | Green | Blue
| | z | | 18.86
| | znorm | | 14.68
| | sky | 15.0 | 14.8 | 15.1
| | S/N | 13.9 | 23.0 | 25.4
| | S/N(c) | 12.2 | 21.3 | 24.1
| | SN(E/C) 0.94
|
| 
| 
| 
| 
| 
|
| 3650053
| 47
| | Red | Green | Blue
| | z | | 18.73
| | znorm | | 14.55
| | sky | 14.8 | 14.8 | 15.3
| | S/N | 12.9 | 20.9 | 24.1
| | S/N(c) | 11.3 | 19.3 | 22.2
| | SN(E/C) 0.99
|
| 
| 
| 
| 
| 
|
| 3650054
| 47
| | Red | Green | Blue
| | z | | 18.27
| | znorm | | 14.09
| | sky | 15.1 | 14.8 | 15.1
| | S/N | 8.9 | 16.3 | 18.2
| | S/N(c) | 7.6 | 14.9 | 16.7
| | SN(E/C) 0.96
|
| 
| 
| 
| 
| 
|