| Red | Green | Blue | |
| z | 17.64 | ||
| znorm | Inf | ||
| sky | -Inf | -Inf | -Inf |
| S/N | 17.9 | 32.1 | 36.5 |
| S/N(c) | 0.0 | 0.0 | 0.0 |
| SN(E/C) |
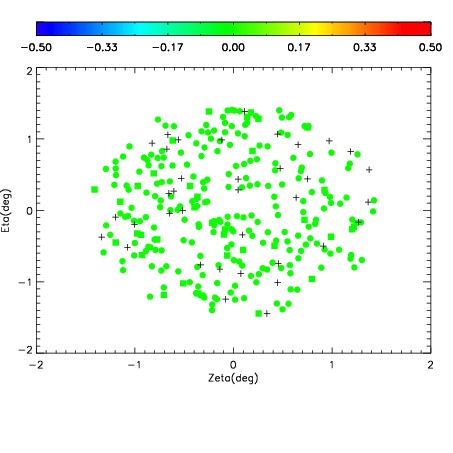
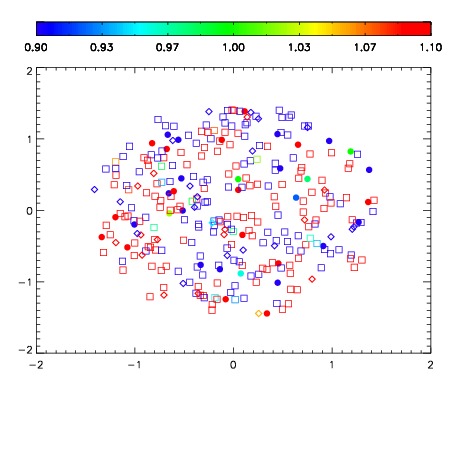


| Frame | Nreads | Zeropoints | Mag plots | Spatial mag deviation | Spatial sky 16325A emission deviations (filled: sky, open: star) | Spatial sky continuum emission | Spatial sky telluric CO2 absorption deviations (filled: H < 10) | |||||||||||||||||||||||
| 0 | 0 |
|
|
|
|
|
|
| IPAIR | NAME | SHIFT | NEWSHIFT | S/N | NAME | SHIFT | NEWSHIFT | S/N |
| 0 | 03650049 | 0.509640 | 0.00000 | 132.368 | 03650050 | 0.00210079 | 0.507539 | 119.026 |
| 1 | 03650052 | 0.505302 | 0.00433797 | 175.070 | 03650047 | 0.00000 | 0.509640 | 144.355 |
| 2 | 03650053 | 0.507856 | 0.00178397 | 164.263 | 03650054 | 0.00331508 | 0.506325 | 131.790 |
| 3 | 03650048 | 0.507002 | 0.00263798 | 139.662 | 03650051 | 0.00150006 | 0.508140 | 130.992 |