| Red | Green | Blue | |
| z | 17.64 | ||
| znorm | Inf | ||
| sky | -Inf | -Inf | -Inf |
| S/N | 29.0 | 47.9 | 52.2 |
| S/N(c) | 0.0 | 0.0 | 0.0 |
| SN(E/C) |
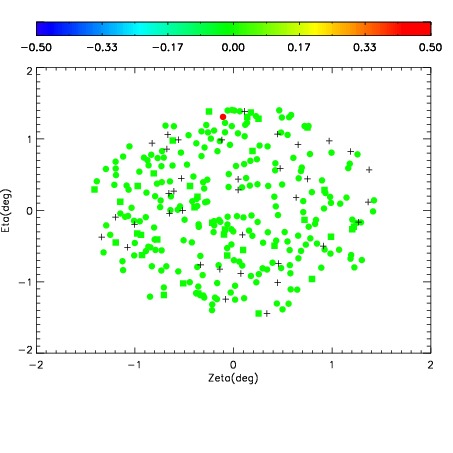
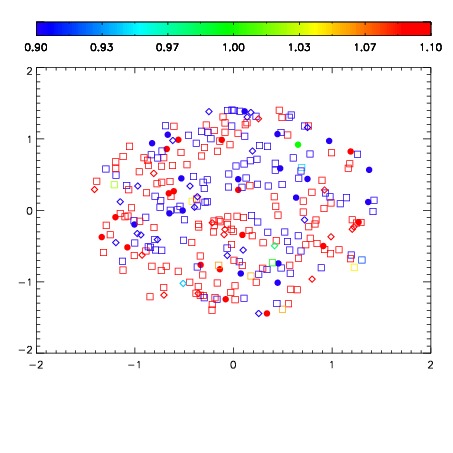


| Frame | Nreads | Zeropoints | Mag plots | Spatial mag deviation | Spatial sky 16325A emission deviations (filled: sky, open: star) | Spatial sky continuum emission | Spatial sky telluric CO2 absorption deviations (filled: H < 10) | |||||||||||||||||||||||
| 0 | 0 |
|
|
|
|
|
|
| IPAIR | NAME | SHIFT | NEWSHIFT | S/N | NAME | SHIFT | NEWSHIFT | S/N |
| 0 | 03710046 | 0.504915 | 0.00000 | 205.219 | 03710044 | 0.000533252 | 0.504382 | 202.853 |
| 1 | 03710045 | 0.502426 | 0.00248897 | 208.702 | 03710047 | 0.00221243 | 0.502703 | 208.890 |
| 2 | 03710042 | 0.500219 | 0.00469601 | 206.785 | 03710043 | 0.00104221 | 0.503873 | 206.065 |
| 3 | 03710041 | 0.498056 | 0.00685900 | 203.032 | 03710040 | 0.00000 | 0.504915 | 194.471 |