| Red | Green | Blue | |
| z | 17.64 | ||
| znorm | Inf | ||
| sky | -Inf | -Inf | -Inf |
| S/N | 27.5 | 48.1 | 55.2 |
| S/N(c) | 0.0 | 0.0 | 0.0 |
| SN(E/C) |

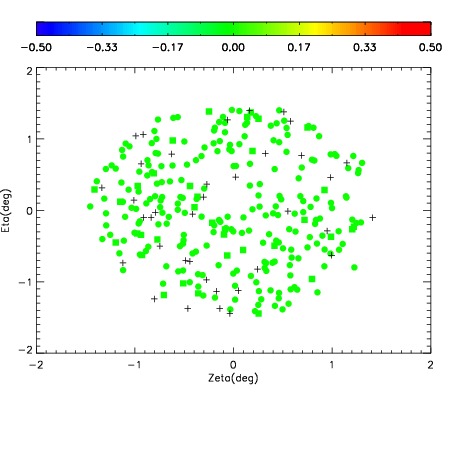
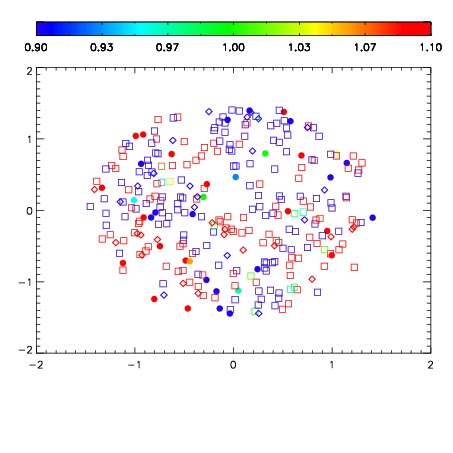
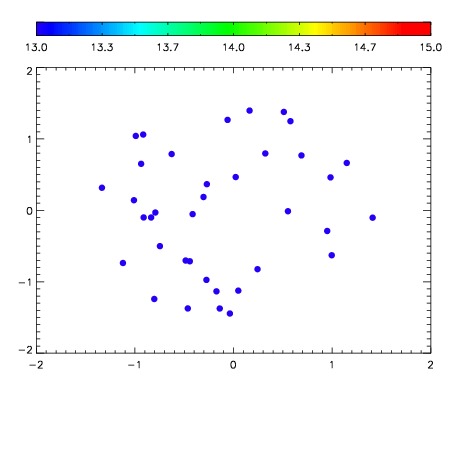

| Frame | Nreads | Zeropoints | Mag plots | Spatial mag deviation | Spatial sky 16325A emission deviations (filled: sky, open: star) | Spatial sky continuum emission | Spatial sky telluric CO2 absorption deviations (filled: H < 10) | |||||||||||||||||||||||
| 0 | 0 |
|
|
|
|
|
|
| IPAIR | NAME | SHIFT | NEWSHIFT | S/N | NAME | SHIFT | NEWSHIFT | S/N |
| 0 | 02860092 | 0.411858 | 0.00000 | 229.765 | 02860093 | -1.79636e-05 | 0.411876 | 227.312 |
| 1 | 02860087 | 0.408542 | 0.00331599 | 237.027 | 02860086 | 0.00000 | 0.411858 | 236.164 |
| 2 | 02860088 | 0.409586 | 0.00227198 | 235.155 | 02860089 | 0.000570728 | 0.411287 | 234.323 |
| 3 | 02860091 | 0.410401 | 0.00145701 | 229.998 | 02860090 | -0.00117218 | 0.413030 | 232.619 |