| Red | Green | Blue | |
| z | 17.64 | ||
| znorm | Inf | ||
| sky | -Inf | -NaN | -Inf |
| S/N | 30.8 | 55.7 | 63.0 |
| S/N(c) | 0.0 | 0.0 | 0.0 |
| SN(E/C) |
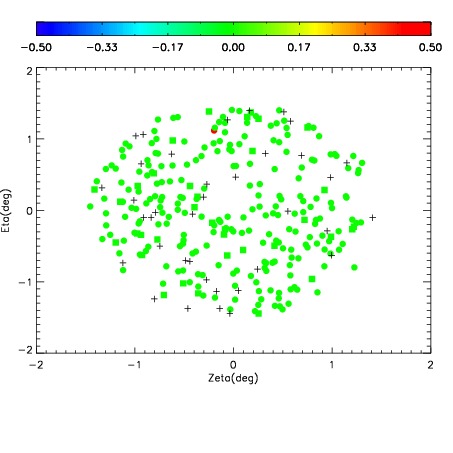
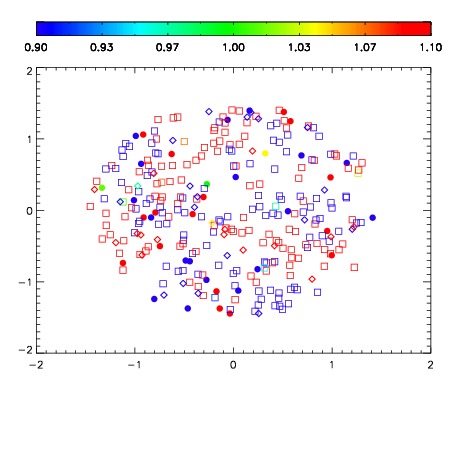
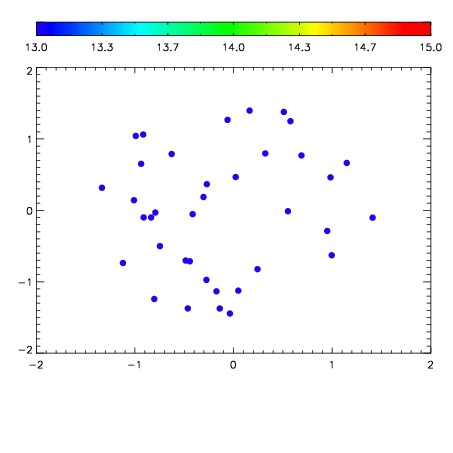

| Frame | Nreads | Zeropoints | Mag plots | Spatial mag deviation | Spatial sky 16325A emission deviations (filled: sky, open: star) | Spatial sky continuum emission | Spatial sky telluric CO2 absorption deviations (filled: H < 10) | |||||||||||||||||||||||
| 0 | 0 |
|
|
|
|
|
|
| IPAIR | NAME | SHIFT | NEWSHIFT | S/N | NAME | SHIFT | NEWSHIFT | S/N |
| 0 | 03660045 | 0.499848 | 0.00000 | 240.917 | 03660046 | -4.69991e-05 | 0.499895 | 239.878 |
| 1 | 03660040 | 0.496364 | 0.00348401 | 238.530 | 03660039 | -6.83877e-06 | 0.499855 | 232.611 |
| 2 | 03660044 | 0.496564 | 0.00328401 | 227.533 | 03660043 | -0.00179694 | 0.501645 | 226.707 |
| 3 | 03660041 | 0.498550 | 0.00129801 | 219.757 | 03660038 | 0.00115361 | 0.498694 | 213.295 |
| 4 | 03660037 | 0.499104 | 0.000744015 | 204.692 | 03660042 | -7.03218e-05 | 0.499918 | 212.278 |
| 5 | 03660036 | 0.496537 | 0.00331101 | 180.744 | 03660035 | 0.00000 | 0.499848 | 170.240 |