| Red | Green | Blue | |
| z | 17.64 | ||
| znorm | Inf | ||
| sky | -Inf | -Inf | -Inf |
| S/N | 22.4 | 40.1 | 46.2 |
| S/N(c) | 0.0 | 0.0 | 0.0 |
| SN(E/C) |
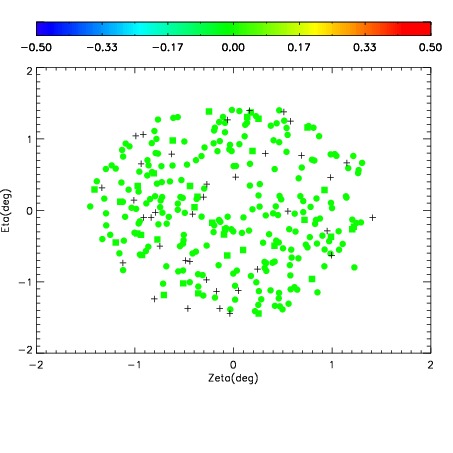
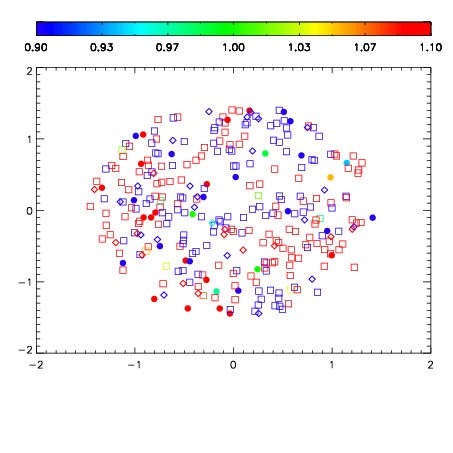
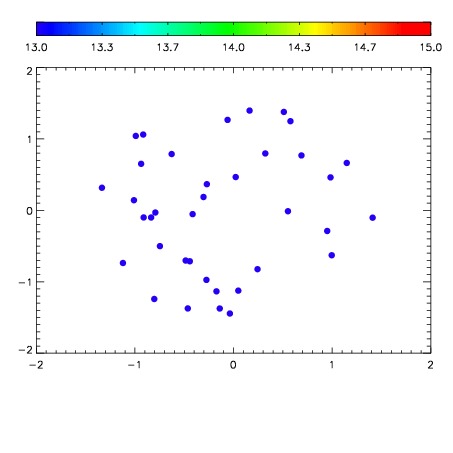

| Frame | Nreads | Zeropoints | Mag plots | Spatial mag deviation | Spatial sky 16325A emission deviations (filled: sky, open: star) | Spatial sky continuum emission | Spatial sky telluric CO2 absorption deviations (filled: H < 10) | |||||||||||||||||||||||
| 0 | 0 |
|
|
|
|
|
|
| IPAIR | NAME | SHIFT | NEWSHIFT | S/N | NAME | SHIFT | NEWSHIFT | S/N |
| 0 | 04050038 | 0.499583 | 0.00000 | 208.802 | 04050039 | 0.00177843 | 0.497805 | 196.908 |
| 1 | 04050037 | 0.498133 | 0.00145000 | 224.723 | 04050043 | 0.00288222 | 0.496701 | 222.419 |
| 2 | 04050041 | 0.496401 | 0.00318199 | 222.745 | 04050036 | 0.00000 | 0.499583 | 217.840 |
| 3 | 04050042 | 0.498930 | 0.000652999 | 212.403 | 04050040 | 0.00106887 | 0.498514 | 205.967 |