| Red | Green | Blue | |
| z | 17.64 | ||
| znorm | Inf | ||
| sky | -Inf | -Inf | -Inf |
| S/N | 30.9 | 54.8 | 59.6 |
| S/N(c) | 0.0 | 0.0 | 0.0 |
| SN(E/C) |
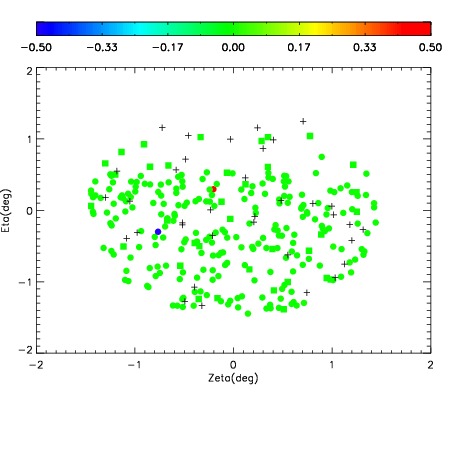
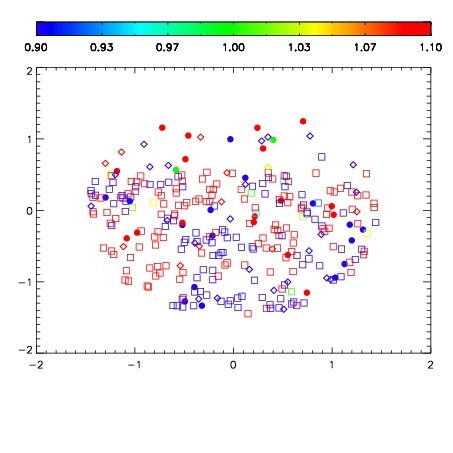
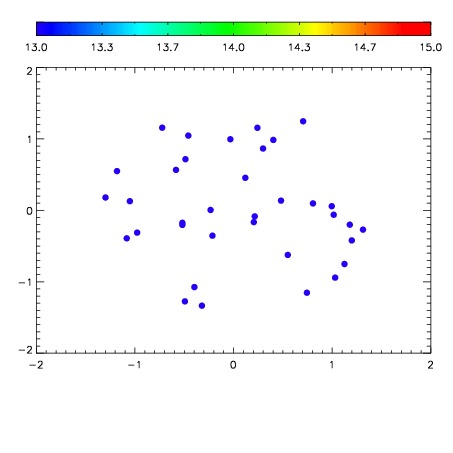

| Frame | Nreads | Zeropoints | Mag plots | Spatial mag deviation | Spatial sky 16325A emission deviations (filled: sky, open: star) | Spatial sky continuum emission | Spatial sky telluric CO2 absorption deviations (filled: H < 10) | |||||||||||||||||||||||
| 0 | 0 |
|
|
|
|
|
|
| IPAIR | NAME | SHIFT | NEWSHIFT | S/N | NAME | SHIFT | NEWSHIFT | S/N |
| 0 | 03130020 | 0.505239 | 0.00000 | 183.364 | 03130013 | -0.00216348 | 0.507402 | 163.282 |
| 1 | 03130012 | 0.503465 | 0.00177401 | 187.087 | 03130010 | 0.00000 | 0.505239 | 185.835 |
| 2 | 03130016 | 0.504495 | 0.000743985 | 186.417 | 03130021 | -0.000715135 | 0.505954 | 185.764 |
| 3 | 03130011 | 0.502358 | 0.00288099 | 184.855 | 03130017 | -0.000988238 | 0.506227 | 178.264 |
| 4 | 03130015 | 0.503779 | 0.00146002 | 184.118 | 03130018 | -0.00144020 | 0.506679 | 177.171 |
| 5 | 03130019 | 0.503908 | 0.00133103 | 169.916 | 03130014 | -0.00201424 | 0.507253 | 158.583 |