| Red | Green | Blue | |
| z | 17.64 | ||
| znorm | Inf | ||
| sky | -Inf | -Inf | -Inf |
| S/N | 29.9 | 53.1 | 63.2 |
| S/N(c) | 0.0 | 0.0 | 0.0 |
| SN(E/C) |
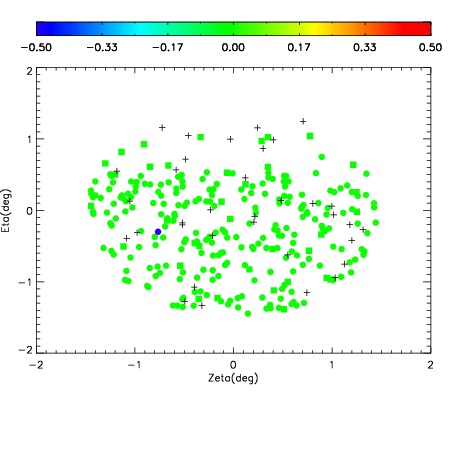
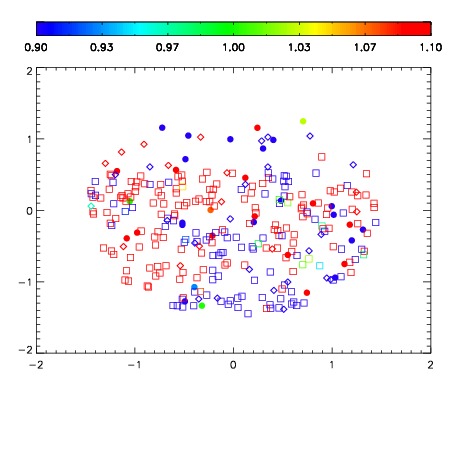
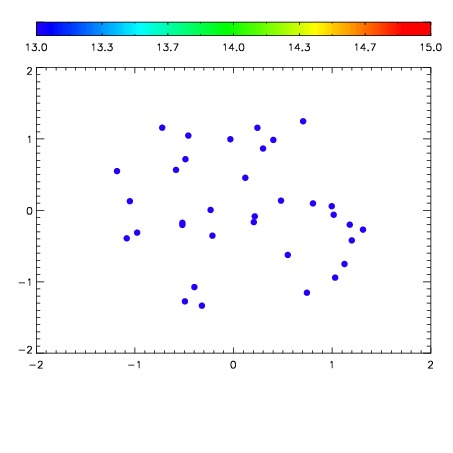

| Frame | Nreads | Zeropoints | Mag plots | Spatial mag deviation | Spatial sky 16325A emission deviations (filled: sky, open: star) | Spatial sky continuum emission | Spatial sky telluric CO2 absorption deviations (filled: H < 10) | |||||||||||||||||||||||
| 0 | 0 |
|
|
|
|
|
|
| IPAIR | NAME | SHIFT | NEWSHIFT | S/N | NAME | SHIFT | NEWSHIFT | S/N |
| 0 | 03680051 | 0.499429 | 0.00000 | 168.980 | 03680052 | 0.00223629 | 0.497193 | 167.281 |
| 1 | 03680054 | 0.496989 | 0.00243998 | 176.344 | 03680053 | 0.000978709 | 0.498450 | 172.959 |
| 2 | 03680055 | 0.497762 | 0.00166699 | 174.672 | 03680056 | 0.00103191 | 0.498397 | 171.919 |
| 3 | 03680050 | 0.498055 | 0.00137398 | 160.600 | 03680049 | 0.00228972 | 0.497139 | 138.868 |
| 4 | 03680047 | 0.498862 | 0.000566989 | 139.929 | 03680048 | 0.00195750 | 0.497471 | 132.367 |
| 5 | 03680046 | 0.498902 | 0.000526994 | 99.1476 | 03680045 | 0.00000 | 0.499429 | 111.357 |