| Red | Green | Blue | |
| z | 17.64 | ||
| znorm | Inf | ||
| sky | -Inf | -Inf | -Inf |
| S/N | 30.0 | 52.1 | 55.7 |
| S/N(c) | 0.0 | 0.0 | 0.0 |
| SN(E/C) |
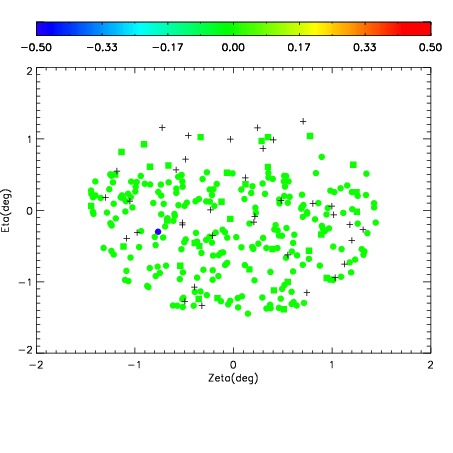
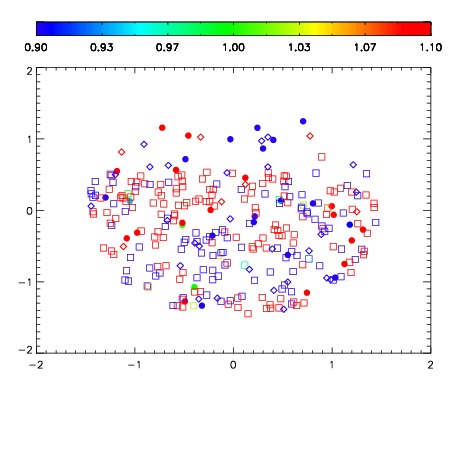
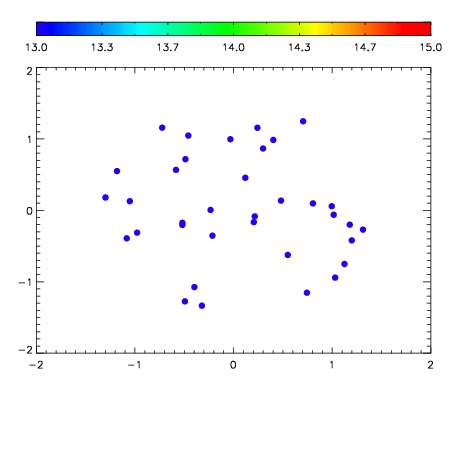

| Frame | Nreads | Zeropoints | Mag plots | Spatial mag deviation | Spatial sky 16325A emission deviations (filled: sky, open: star) | Spatial sky continuum emission | Spatial sky telluric CO2 absorption deviations (filled: H < 10) | |||||||||||||||||||||||
| 0 | 0 |
|
|
|
|
|
|
| IPAIR | NAME | SHIFT | NEWSHIFT | S/N | NAME | SHIFT | NEWSHIFT | S/N |
| 0 | 03750061 | 0.509155 | 0.00000 | 199.935 | 03750058 | 0.00340619 | 0.505749 | 200.461 |
| 1 | 03750060 | 0.503624 | 0.00553095 | 198.330 | 03750059 | 0.00223459 | 0.506920 | 197.312 |
| 2 | 03750056 | 0.505054 | 0.00410098 | 197.782 | 03750062 | 0.00206273 | 0.507092 | 193.204 |
| 3 | 03750057 | 0.507790 | 0.00136495 | 196.571 | 03750055 | 0.00000 | 0.509155 | 191.793 |