| Red | Green | Blue | |
| z | 17.64 | ||
| znorm | Inf | ||
| sky | -Inf | -Inf | -Inf |
| S/N | 11.3 | 20.1 | 22.4 |
| S/N(c) | 0.0 | 0.0 | 0.0 |
| SN(E/C) |

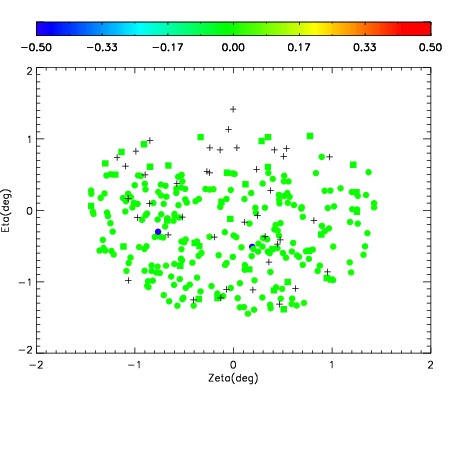
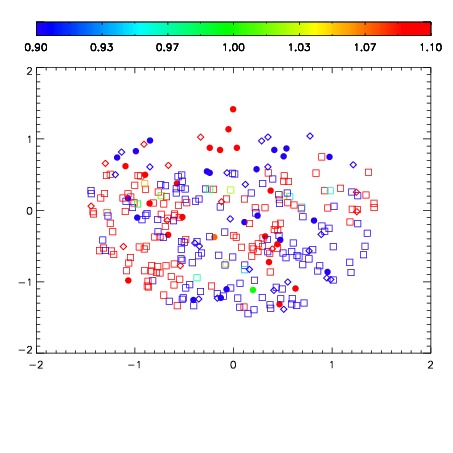
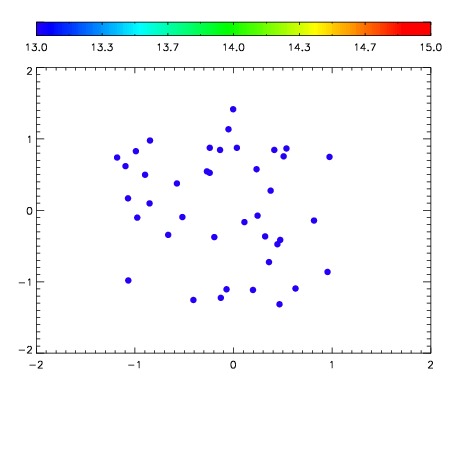

| Frame | Nreads | Zeropoints | Mag plots | Spatial mag deviation | Spatial sky 16325A emission deviations (filled: sky, open: star) | Spatial sky continuum emission | Spatial sky telluric CO2 absorption deviations (filled: H < 10) | |||||||||||||||||||||||
| 0 | 0 |
|
|
|
|
|
|
| IPAIR | NAME | SHIFT | NEWSHIFT | S/N | NAME | SHIFT | NEWSHIFT | S/N |
| 0 | 03140079 | 0.514707 | 0.00000 | 104.351 | 03140076 | 0.00544486 | 0.509262 | 130.239 |
| 1 | 03140078 | 0.511971 | 0.00273603 | 124.527 | 03140077 | 0.00811143 | 0.506596 | 133.453 |
| 2 | 03140075 | 0.513745 | 0.000962019 | 92.4628 | 03140080 | 0.00623978 | 0.508467 | 105.734 |
| 3 | 03140074 | 0.511894 | 0.00281304 | 70.5790 | 03140073 | 0.00000 | 0.514707 | 63.5461 |