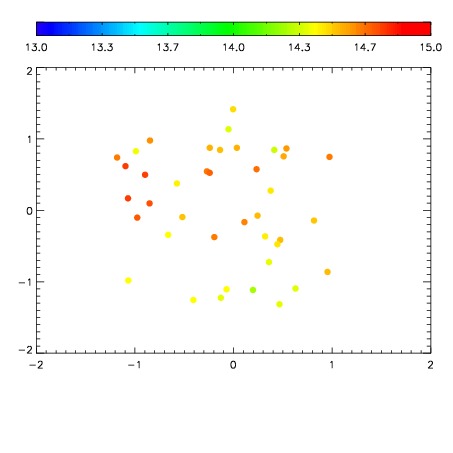
| Frame | Nreads | Zeropoints | Mag plots
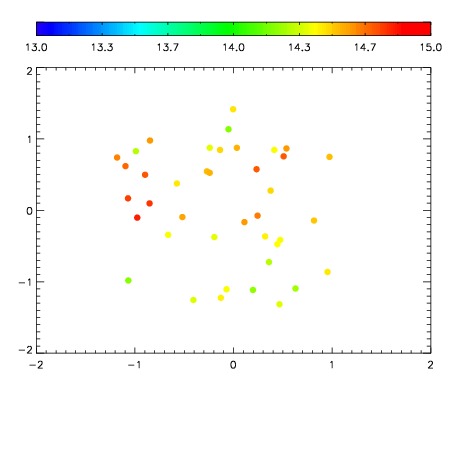
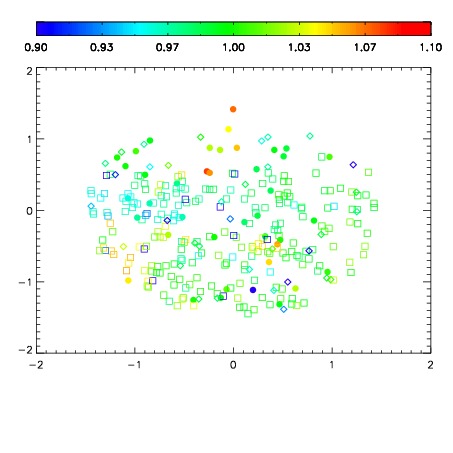
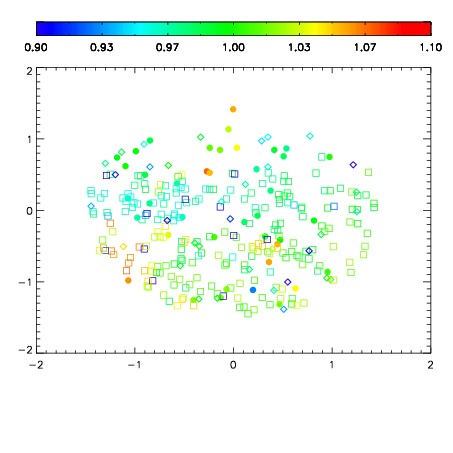
| Spatial mag deviation
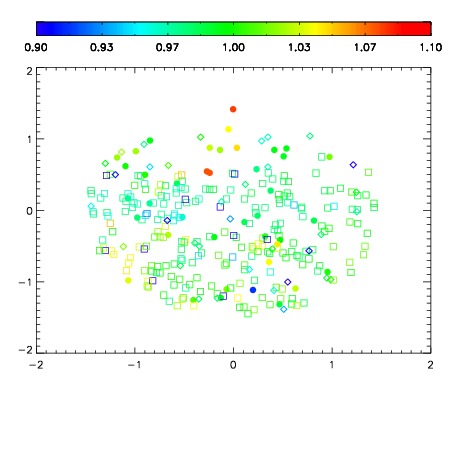
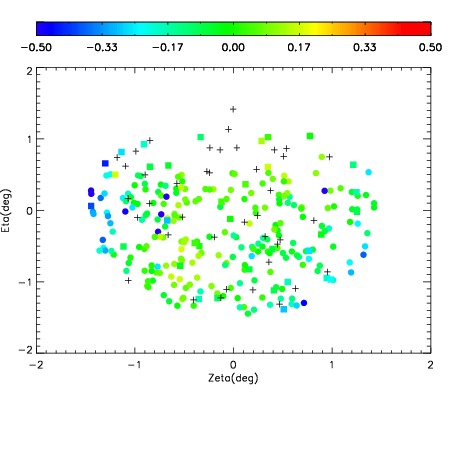
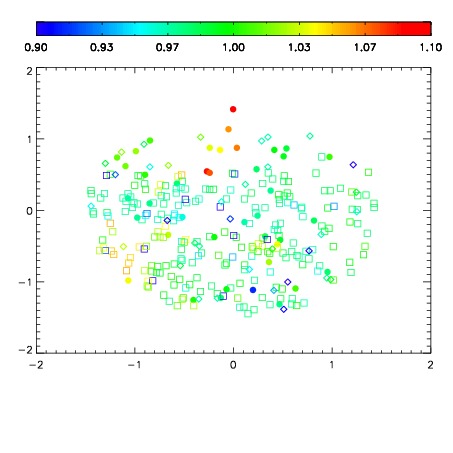
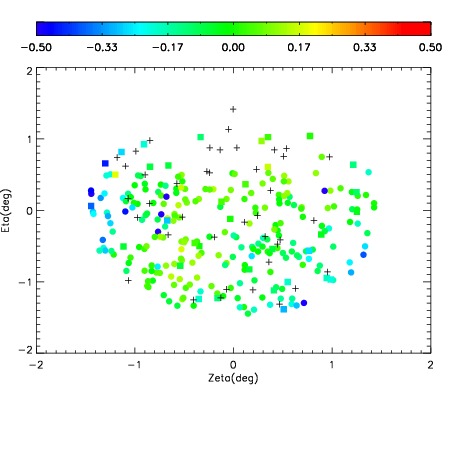
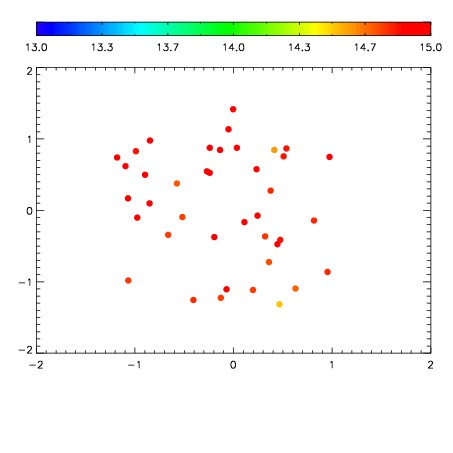
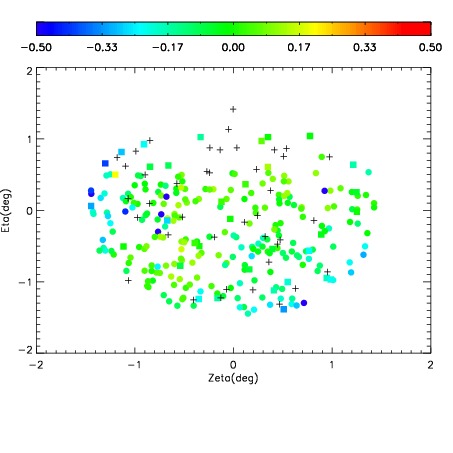
| Spatial sky 16325A emission deviations (filled: sky, open: star)
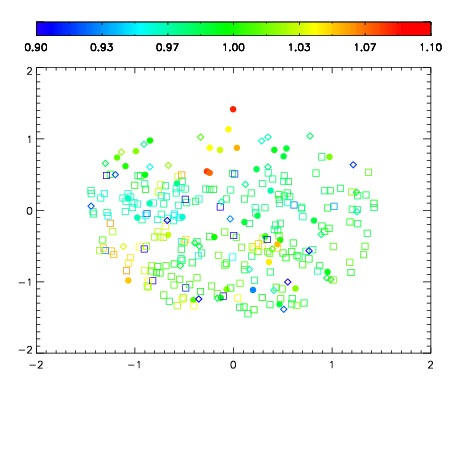
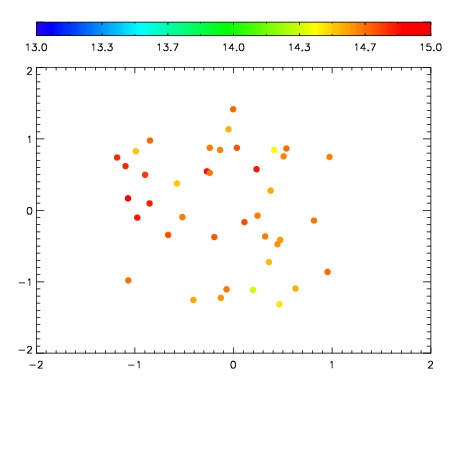
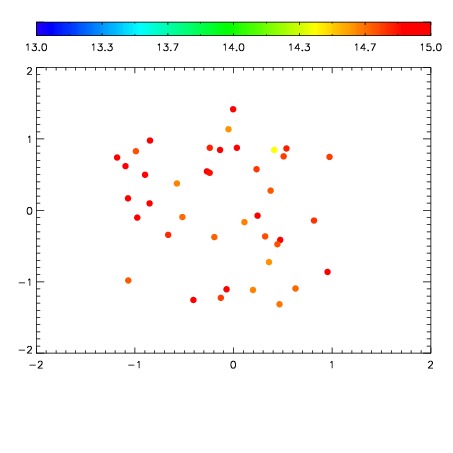
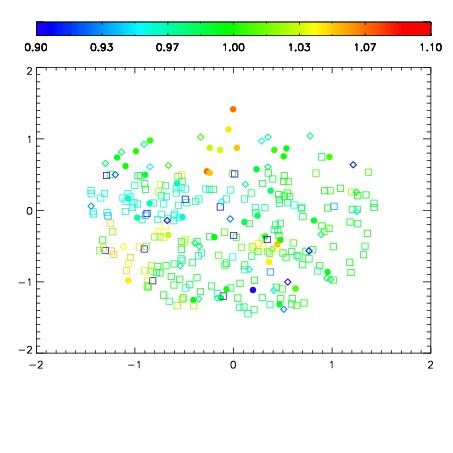
| Spatial sky continuum emission
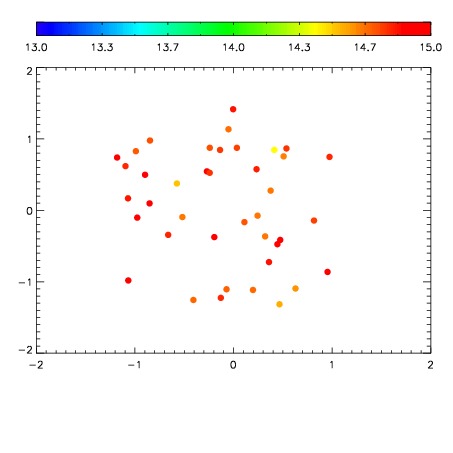
| Spatial sky telluric CO2 absorption deviations (filled: H < 10)
|
| 3690045
| 47
| | Red | Green | Blue
| | z | | 18.99
| | znorm | | 14.81
| | sky | 15.2 | 14.5 | 14.7
| | S/N | 15.4 | 25.3 | 27.7
| | S/N(c) | 13.3 | 23.3 | 25.9
| | SN(E/C) 0.98
|
| 
| 
| 
| 
| 
|
| 3690046
| 47
| | Red | Green | Blue
| | z | | 18.98
| | znorm | | 14.80
| | sky | 14.9 | 14.5 | 15.0
| | S/N | 15.5 | 25.5 | 28.2
| | S/N(c) | 13.6 | 23.7 | 26.4
| | SN(E/C) 0.94
|
| 
| 
| 
| 
| 
|
| 3690047
| 47
| | Red | Green | Blue
| | z | | 19.02
| | znorm | | 14.84
| | sky | 14.8 | 14.7 | 15.0
| | S/N | 15.9 | 26.3 | 28.3
| | S/N(c) | 14.1 | 24.6 | 26.5
| | SN(E/C) 0.95
|
| 
| 
| 
| 
| 
|
| 3690048
| 47
| | Red | Green | Blue
| | z | | 18.96
| | znorm | | 14.78
| | sky | 15.0 | 14.8 | 15.0
| | S/N | 15.2 | 25.3 | 27.1
| | S/N(c) | 13.3 | 23.6 | 25.3
| | SN(E/C) 0.97
|
| 
| 
| 
| 
| 
|
| 3690049
| 47
| | Red | Green | Blue
| | z | | 19.04
| | znorm | | 14.86
| | sky | 15.0 | 14.8 | 14.8
| | S/N | 16.0 | 26.6 | 28.1
| | S/N(c) | 14.0 | 24.5 | 26.2
| | SN(E/C) 0.98
|
| 
| 
| 
| 
| 
|
| 3690050
| 47
| | Red | Green | Blue
| | z | | 19.09
| | znorm | | 14.91
| | sky | 14.8 | 14.6 | 14.9
| | S/N | 16.3 | 27.3 | 29.2
| | S/N(c) | 14.2 | 24.9 | 27.4
| | SN(E/C) 0.95
|
| 
| 
| 
| 
| 
|
| 3690051
| 47
| | Red | Green | Blue
| | z | | 19.02
| | znorm | | 14.84
| | sky | 14.8 | 14.9 | 15.2
| | S/N | 15.4 | 26.1 | 27.8
| | S/N(c) | 13.4 | 23.8 | 25.9
| | SN(E/C) 1.00
|
| 
| 
| 
| 
| 
|
| 3690052
| 47
| | Red | Green | Blue
| | z | | 19.00
| | znorm | | 14.82
| | sky | 14.9 | 14.8 | 15.0
| | S/N | 15.4 | 25.6 | 27.6
| | S/N(c) | 13.4 | 23.8 | 25.7
| | SN(E/C) 0.95
|
| 
| 
| 
| 
| 
|