| Red | Green | Blue | |
| z | 17.64 | ||
| znorm | Inf | ||
| sky | -Inf | -Inf | -Inf |
| S/N | 28.5 | 50.2 | 54.2 |
| S/N(c) | 0.0 | 0.0 | 0.0 |
| SN(E/C) |
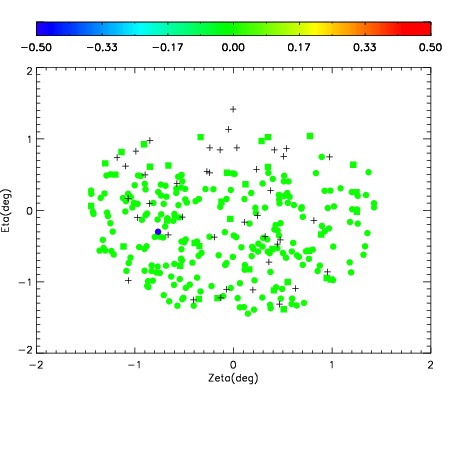
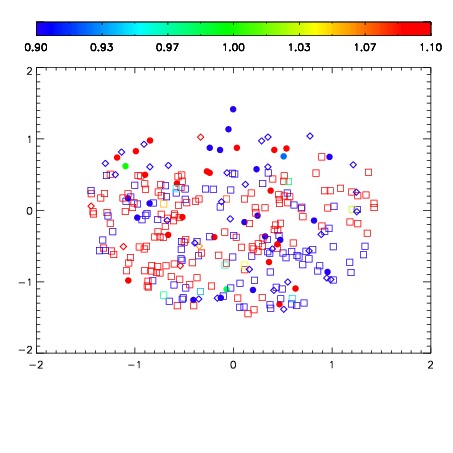
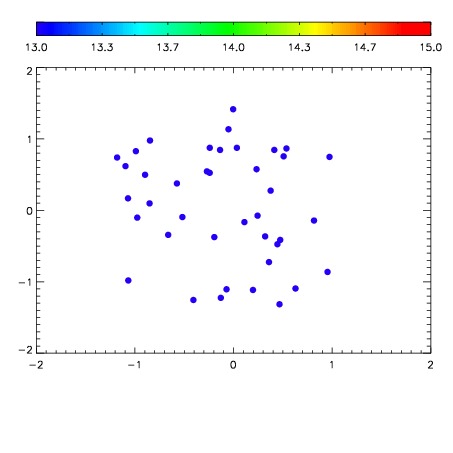

| Frame | Nreads | Zeropoints | Mag plots | Spatial mag deviation | Spatial sky 16325A emission deviations (filled: sky, open: star) | Spatial sky continuum emission | Spatial sky telluric CO2 absorption deviations (filled: H < 10) | |||||||||||||||||||||||
| 0 | 0 |
|
|
|
|
|
|
| IPAIR | NAME | SHIFT | NEWSHIFT | S/N | NAME | SHIFT | NEWSHIFT | S/N |
| 0 | 03780012 | 0.503979 | 0.00000 | 183.284 | 03780013 | 0.00133873 | 0.502640 | 185.970 |
| 1 | 03780015 | 0.501650 | 0.00232905 | 191.098 | 03780017 | 9.59582e-05 | 0.503883 | 189.710 |
| 2 | 03780016 | 0.502218 | 0.00176102 | 188.209 | 03780010 | 0.00000 | 0.503979 | 187.899 |
| 3 | 03780011 | 0.503219 | 0.000760019 | 181.691 | 03780014 | -0.00319551 | 0.507175 | 181.965 |