| Red | Green | Blue | |
| z | 17.64 | ||
| znorm | Inf | ||
| sky | -Inf | -Inf | -Inf |
| S/N | 24.1 | 43.3 | 46.7 |
| S/N(c) | 0.0 | 0.0 | 0.0 |
| SN(E/C) |
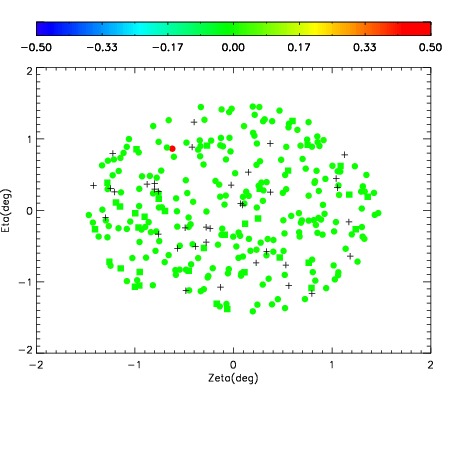
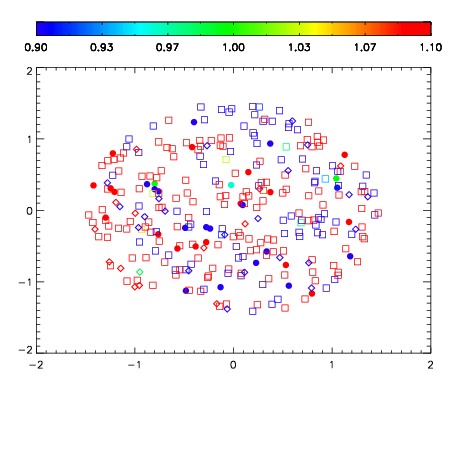


| Frame | Nreads | Zeropoints | Mag plots | Spatial mag deviation | Spatial sky 16325A emission deviations (filled: sky, open: star) | Spatial sky continuum emission | Spatial sky telluric CO2 absorption deviations (filled: H < 10) | |||||||||||||||||||||||
| 0 | 0 |
|
|
|
|
|
|
| IPAIR | NAME | SHIFT | NEWSHIFT | S/N | NAME | SHIFT | NEWSHIFT | S/N |
| 0 | 02860103 | 0.410839 | 0.00000 | 160.223 | 02860104 | 0.00320020 | 0.407639 | 160.517 |
| 1 | 02860107 | 0.410229 | 0.000609994 | 157.845 | 02860101 | 0.00000 | 0.410839 | 158.911 |
| 2 | 02860102 | 0.409126 | 0.00171298 | 156.967 | 02860105 | 0.00220046 | 0.408639 | 156.813 |
| 3 | 02860106 | 0.408962 | 0.00187698 | 156.069 | 02860108 | 0.00368831 | 0.407151 | 143.406 |