| Red | Green | Blue | |
| z | 17.64 | ||
| znorm | Inf | ||
| sky | -Inf | -Inf | -Inf |
| S/N | 25.2 | 45.8 | 48.3 |
| S/N(c) | 0.0 | 0.0 | 0.0 |
| SN(E/C) |

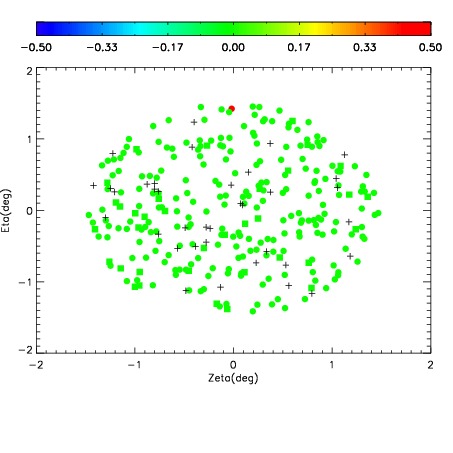
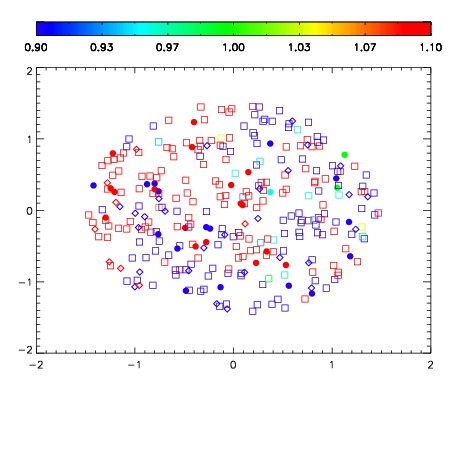


| Frame | Nreads | Zeropoints | Mag plots | Spatial mag deviation | Spatial sky 16325A emission deviations (filled: sky, open: star) | Spatial sky continuum emission | Spatial sky telluric CO2 absorption deviations (filled: H < 10) | |||||||||||||||||||||||
| 0 | 0 |
|
|
|
|
|
|
| IPAIR | NAME | SHIFT | NEWSHIFT | S/N | NAME | SHIFT | NEWSHIFT | S/N |
| 0 | 03120079 | 0.495277 | 0.00000 | 178.484 | 03120080 | 0.00428344 | 0.490994 | 196.776 |
| 1 | 03120074 | 0.493731 | 0.00154600 | 208.403 | 03120073 | 0.00000 | 0.495277 | 205.963 |
| 2 | 03120075 | 0.494390 | 0.000886977 | 204.684 | 03120076 | -0.000181457 | 0.495458 | 202.045 |
| 3 | 03120078 | 0.493230 | 0.00204700 | 178.464 | 03120077 | -0.000699266 | 0.495976 | 184.651 |