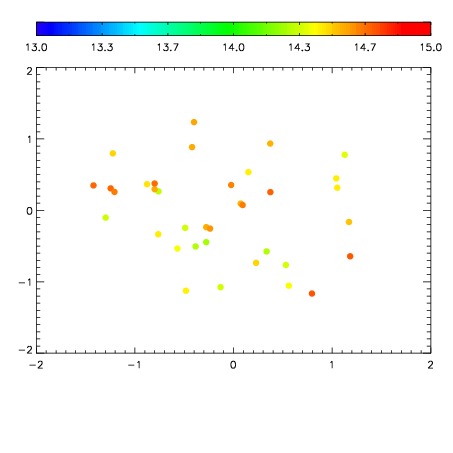
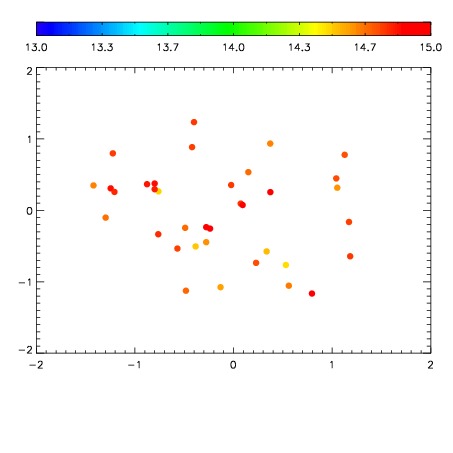
| Frame | Nreads | Zeropoints | Mag plots
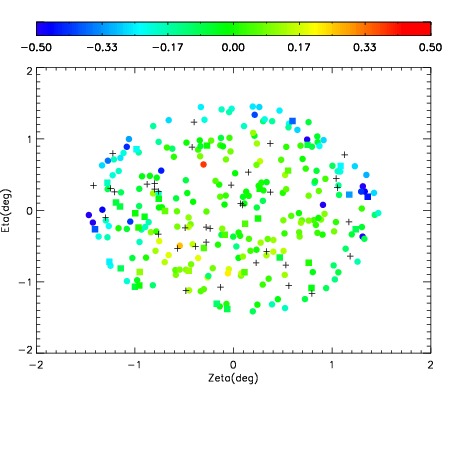
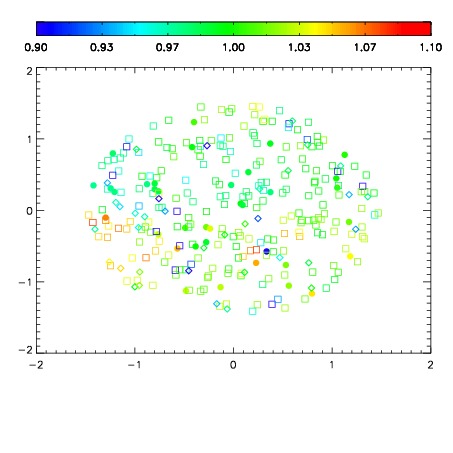
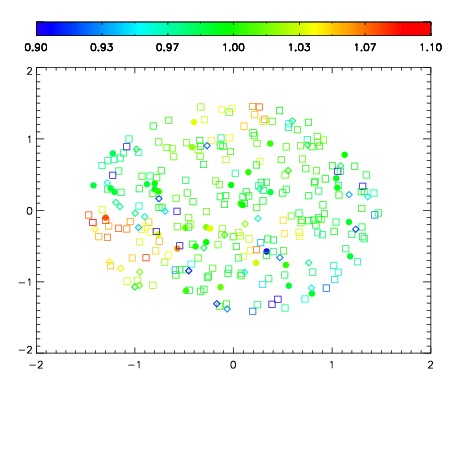
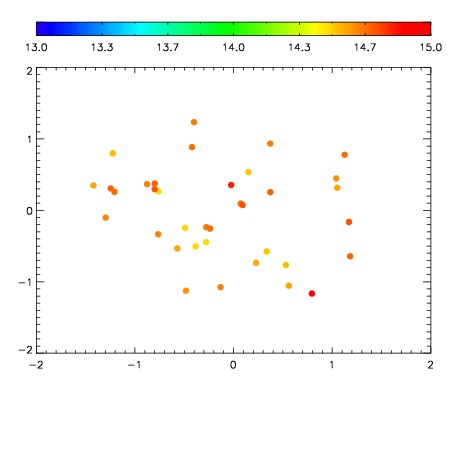
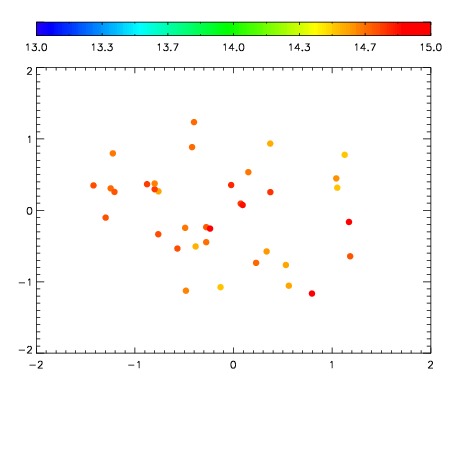
| Spatial mag deviation
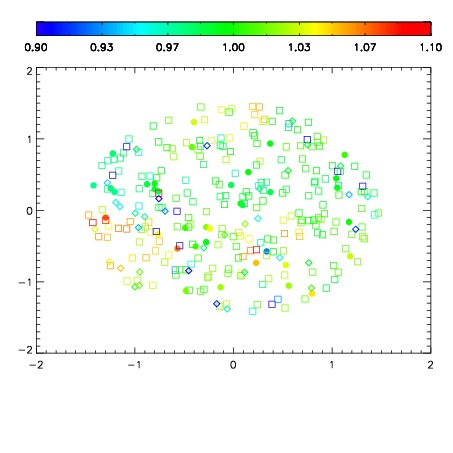
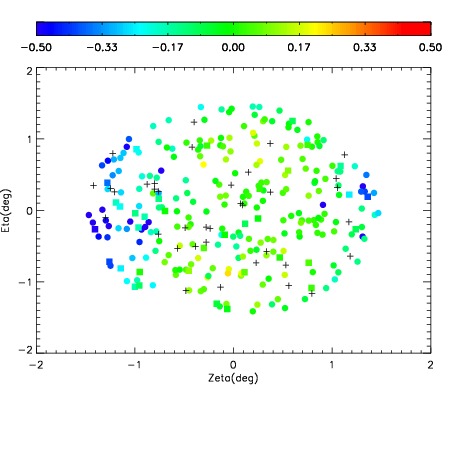
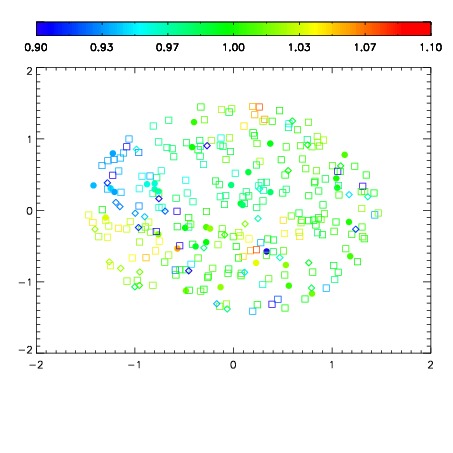
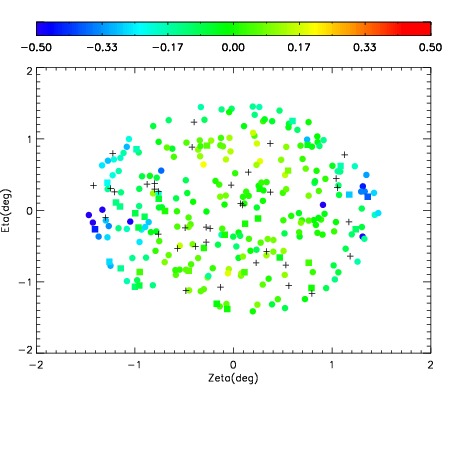
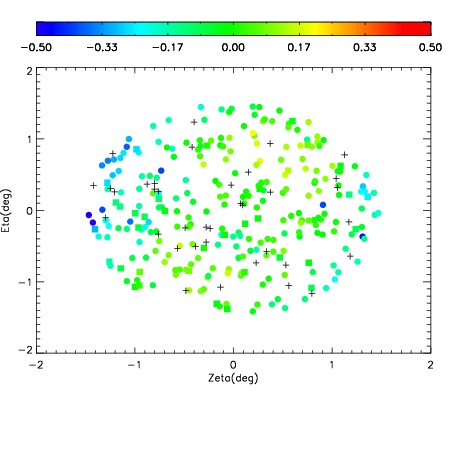
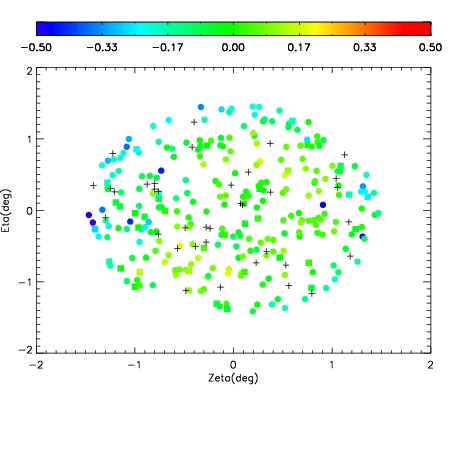
| Spatial sky 16325A emission deviations (filled: sky, open: star)
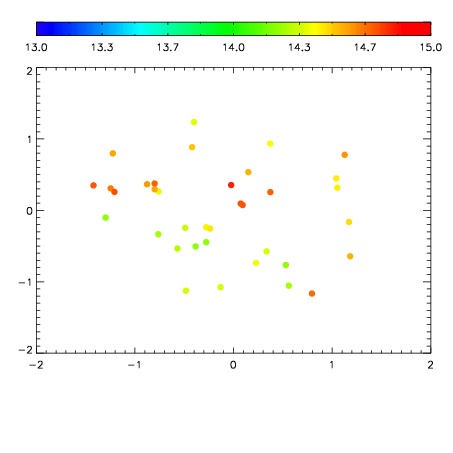
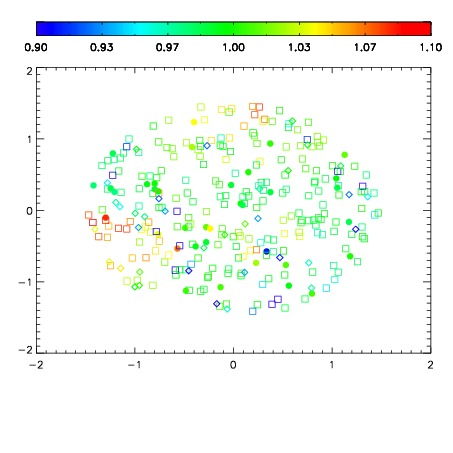
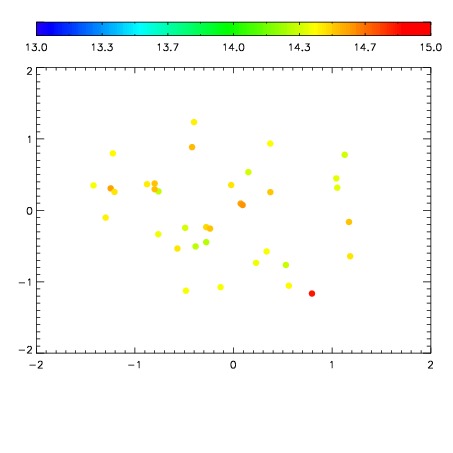
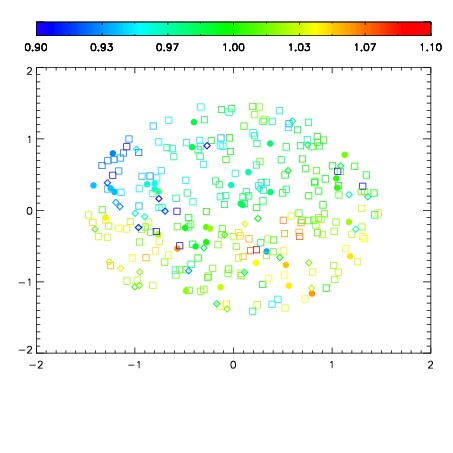
| Spatial sky continuum emission
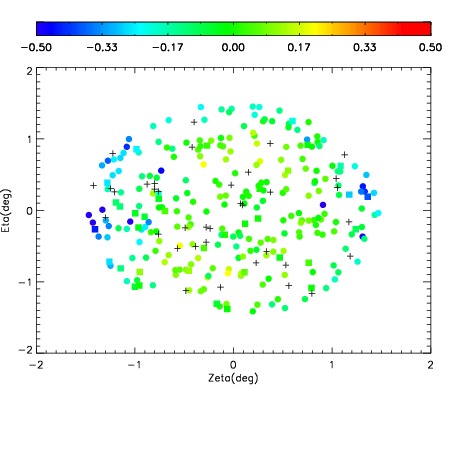
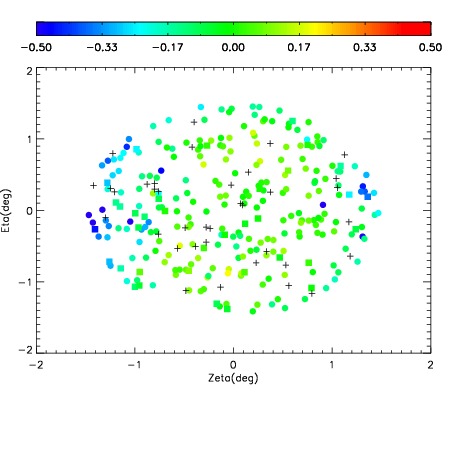
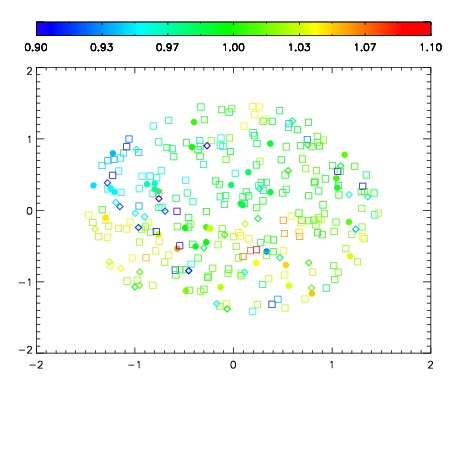
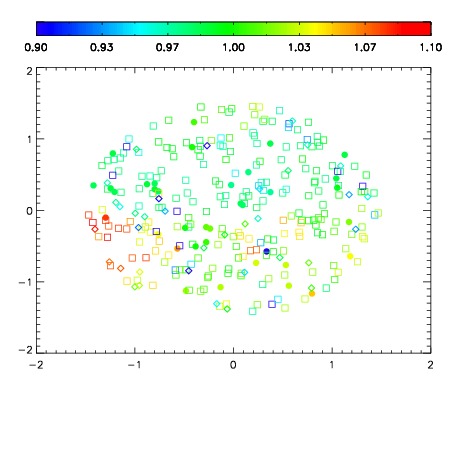
| Spatial sky telluric CO2 absorption deviations (filled: H < 10)
|
| 3430056
| 47
| | Red | Green | Blue
| | z | | 19.02
| | znorm | | 14.84
| | sky | 14.8 | 14.5 | 14.4
| | S/N | 13.1 | 22.2 | 27.2
| | S/N(c) | 11.6 | 21.4 | 25.4
| | SN(E/C) 0.95
|
| 
| 
| 
| 
| 
|
| 3430057
| 47
| | Red | Green | Blue
| | z | | 18.92
| | znorm | | 14.74
| | sky | 14.8 | 14.5 | 14.8
| | S/N | 11.8 | 20.9 | 25.1
| | S/N(c) | 10.4 | 20.0 | 23.0
| | SN(E/C) 0.96
|
| 
| 
| 
| 
| 
|
| 3430058
| 47
| | Red | Green | Blue
| | z | | 18.99
| | znorm | | 14.81
| | sky | 14.8 | 14.6 | 14.8
| | S/N | 13.9 | 23.4 | 27.2
| | S/N(c) | 12.3 | 21.5 | 25.1
| | SN(E/C) 0.93
|
| 
| 
| 
| 
| 
|
| 3430059
| 47
| | Red | Green | Blue
| | z | | 18.99
| | znorm | | 14.81
| | sky | 14.6 | 14.4 | 14.7
| | S/N | 12.4 | 21.7 | 27.1
| | S/N(c) | 10.9 | 20.4 | 25.0
| | SN(E/C) 0.94
|
| 
| 
| 
| 
| 
|
| 3430060
| 47
| | Red | Green | Blue
| | z | | 18.95
| | znorm | | 14.77
| | sky | 14.9 | 14.7 | 14.8
| | S/N | 13.1 | 22.4 | 26.2
| | S/N(c) | 11.4 | 20.2 | 24.4
| | SN(E/C) 0.92
|
| 
| 
| 
| 
| 
|
| 3430061
| 47
| | Red | Green | Blue
| | z | | 18.87
| | znorm | | 14.69
| | sky | 14.9 | 14.6 | 14.9
| | S/N | 12.2 | 21.4 | 25.1
| | S/N(c) | 10.9 | 19.4 | 23.1
| | SN(E/C) 0.96
|
| 
| 
| 
| 
| 
|
| 3430062
| 47
| | Red | Green | Blue
| | z | | 18.64
| | znorm | | 14.46
| | sky | 14.9 | 14.7 | 14.8
| | S/N | 10.9 | 19.1 | 22.4
| | S/N(c) | 9.4 | 17.7 | 20.5
| | SN(E/C) 0.99
|
| 
| 
| 
| 
| 
|
| 3430063
| 47
| | Red | Green | Blue
| | z | | 18.82
| | znorm | | 14.64
| | sky | 14.9 | 14.7 | 14.7
| | S/N | 11.3 | 20.2 | 24.5
| | S/N(c) | 9.9 | 19.1 | 23.0
| | SN(E/C) 0.95
|
| 
| 
| 
| 
| 
|