| Red | Green | Blue | |
| z | 17.64 | ||
| znorm | Inf | ||
| sky | -Inf | -Inf | -Inf |
| S/N | 31.3 | 56.2 | 64.3 |
| S/N(c) | 0.0 | 0.0 | 0.0 |
| SN(E/C) |
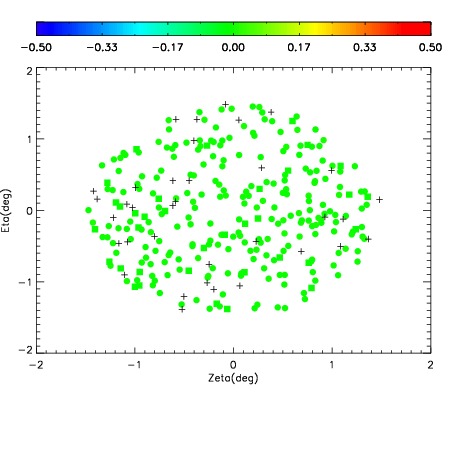
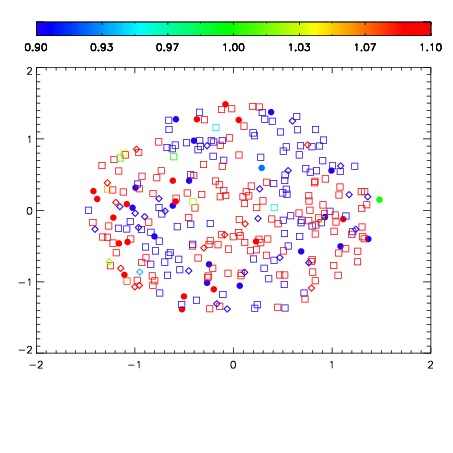
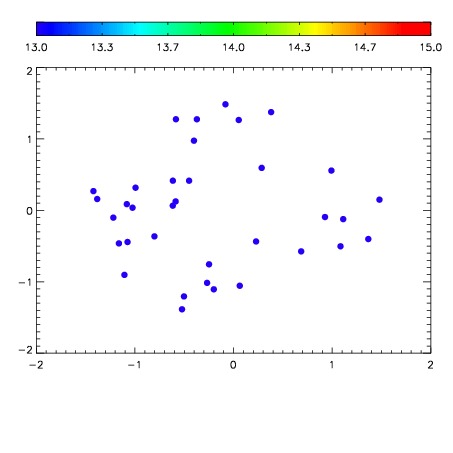

| Frame | Nreads | Zeropoints | Mag plots | Spatial mag deviation | Spatial sky 16325A emission deviations (filled: sky, open: star) | Spatial sky continuum emission | Spatial sky telluric CO2 absorption deviations (filled: H < 10) | |||||||||||||||||||||||
| 0 | 0 |
|
|
|
|
|
|
| IPAIR | NAME | SHIFT | NEWSHIFT | S/N | NAME | SHIFT | NEWSHIFT | S/N |
| 0 | 02810051 | 0.416110 | 0.00000 | 151.672 | 02810060 | -0.00106322 | 0.417173 | 150.969 |
| 1 | 02810062 | 0.409464 | 0.00664601 | 162.286 | 02810064 | -0.00213882 | 0.418249 | 154.045 |
| 2 | 02810058 | 0.409141 | 0.00696900 | 159.454 | 02810061 | -0.00269809 | 0.418808 | 153.861 |
| 3 | 02810059 | 0.410351 | 0.00575900 | 158.984 | 02810057 | -0.00340995 | 0.419520 | 153.299 |
| 4 | 02810063 | 0.411149 | 0.00496101 | 157.138 | 02810053 | -0.00255744 | 0.418667 | 151.351 |
| 5 | 02810055 | 0.413428 | 0.00268200 | 151.592 | 02810056 | -0.000777795 | 0.416888 | 150.368 |
| 6 | 02810050 | 0.411732 | 0.00437802 | 147.279 | 02810052 | -0.000871841 | 0.416982 | 148.184 |
| 7 | 02810054 | 0.410741 | 0.00536901 | 147.185 | 02810049 | 0.00000 | 0.416110 | 143.794 |