| Red | Green | Blue | |
| z | 17.64 | ||
| znorm | Inf | ||
| sky | -Inf | -Inf | -Inf |
| S/N | 26.3 | 44.9 | 53.8 |
| S/N(c) | 0.0 | 0.0 | 0.0 |
| SN(E/C) |
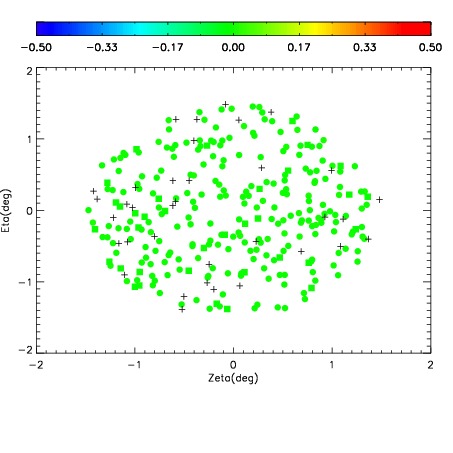
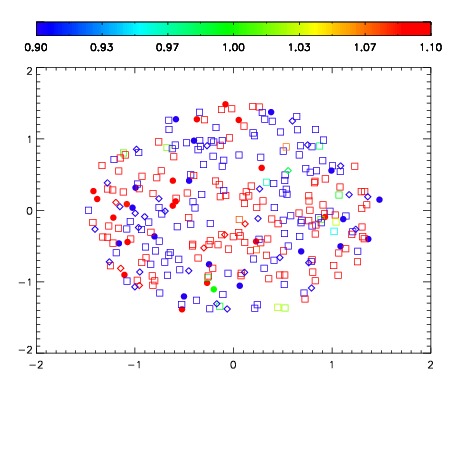
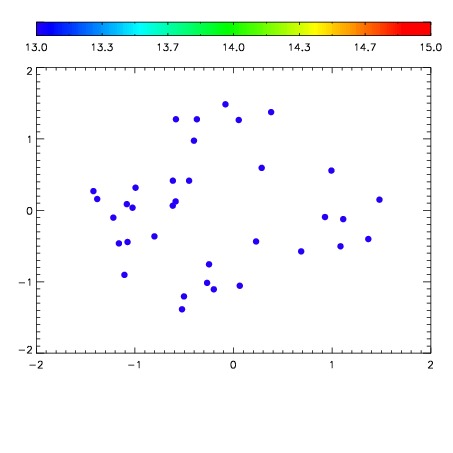

| Frame | Nreads | Zeropoints | Mag plots | Spatial mag deviation | Spatial sky 16325A emission deviations (filled: sky, open: star) | Spatial sky continuum emission | Spatial sky telluric CO2 absorption deviations (filled: H < 10) | |||||||||||||||||||||||
| 0 | 0 |
|
|
|
|
|
|
| IPAIR | NAME | SHIFT | NEWSHIFT | S/N | NAME | SHIFT | NEWSHIFT | S/N |
| 0 | 02820085 | 0.421356 | 0.00000 | 168.008 | 02820083 | 0.00381650 | 0.417540 | 161.809 |
| 1 | 02820084 | 0.418709 | 0.00264698 | 166.509 | 02820082 | 0.00537725 | 0.415979 | 161.748 |
| 2 | 02820081 | 0.415933 | 0.00542298 | 162.623 | 02820086 | 0.00645037 | 0.414906 | 161.486 |
| 3 | 02820080 | 0.415308 | 0.00604799 | 160.893 | 02820079 | 0.00000 | 0.421356 | 157.172 |