| Red | Green | Blue | |
| z | 17.64 | ||
| znorm | Inf | ||
| sky | -Inf | -Inf | -Inf |
| S/N | 21.0 | 38.0 | 41.5 |
| S/N(c) | 0.0 | 0.0 | 0.0 |
| SN(E/C) |
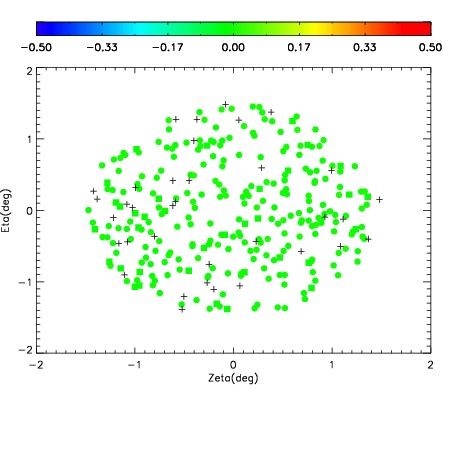
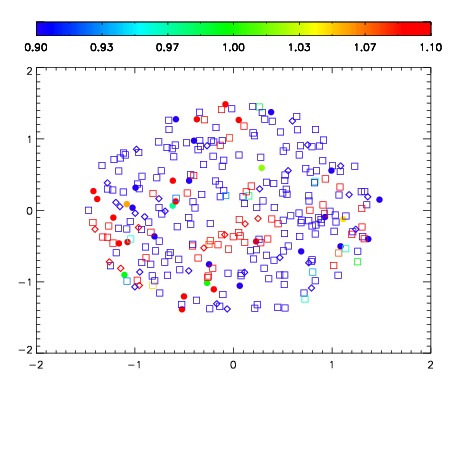
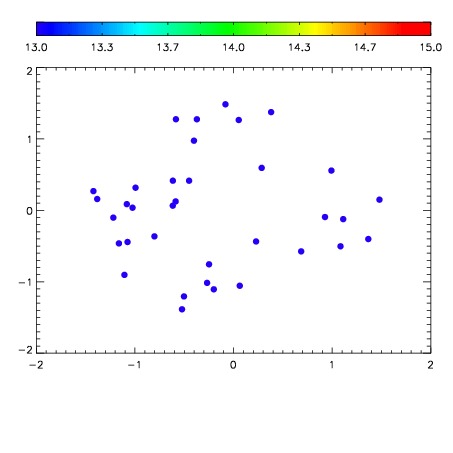

| Frame | Nreads | Zeropoints | Mag plots | Spatial mag deviation | Spatial sky 16325A emission deviations (filled: sky, open: star) | Spatial sky continuum emission | Spatial sky telluric CO2 absorption deviations (filled: H < 10) | |||||||||||||||||||||||
| 0 | 0 |
|
|
|
|
|
|
| IPAIR | NAME | SHIFT | NEWSHIFT | S/N | NAME | SHIFT | NEWSHIFT | S/N |
| 0 | 02830087 | 0.412410 | 0.00000 | 58.7983 | 02830088 | 0.00126040 | 0.411150 | 27.2901 |
| 1 | 02830083 | 0.410859 | 0.00155100 | 178.831 | 02830084 | 0.000480246 | 0.411930 | 175.466 |
| 2 | 02830082 | 0.408895 | 0.00351501 | 167.514 | 02830081 | 0.00000 | 0.412410 | 164.817 |
| 3 | 02830086 | 0.410234 | 0.00217599 | 110.075 | 02830085 | -0.000389075 | 0.412799 | 152.894 |