| Red | Green | Blue | |
| z | 17.64 | ||
| znorm | Inf | ||
| sky | -Inf | -Inf | -Inf |
| S/N | 24.1 | 43.7 | 45.9 |
| S/N(c) | 0.0 | 0.0 | 0.0 |
| SN(E/C) |
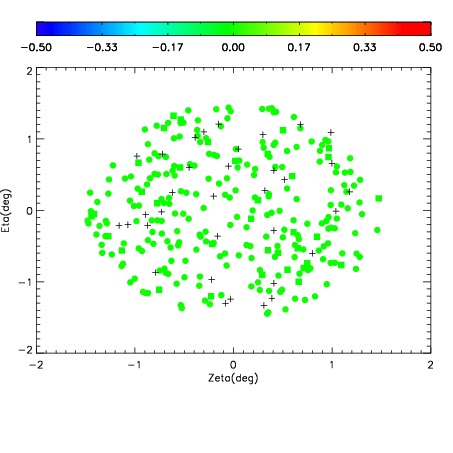
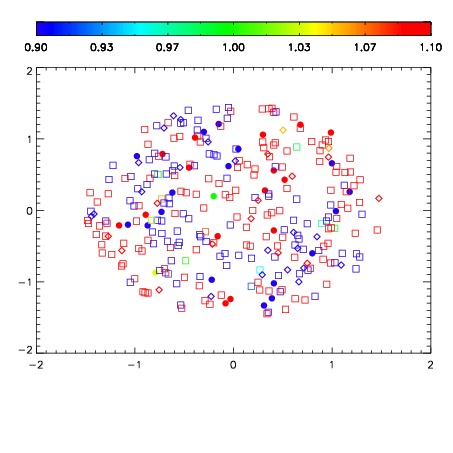


| Frame | Nreads | Zeropoints | Mag plots | Spatial mag deviation | Spatial sky 16325A emission deviations (filled: sky, open: star) | Spatial sky continuum emission | Spatial sky telluric CO2 absorption deviations (filled: H < 10) | |||||||||||||||||||||||
| 0 | 0 |
|
|
|
|
|
|
| IPAIR | NAME | SHIFT | NEWSHIFT | S/N | NAME | SHIFT | NEWSHIFT | S/N |
| 0 | 02900071 | 0.400377 | 0.00000 | 218.305 | 02900069 | 0.00000 | 0.400377 | 219.788 |
| 1 | 02900070 | 0.398405 | 0.00197202 | 221.176 | 02900072 | 0.00113276 | 0.399244 | 220.842 |
| 2 | 02900074 | 0.398665 | 0.00171199 | 215.263 | 02900073 | -0.000207930 | 0.400585 | 211.960 |
| 3 | 02900075 | 0.400175 | 0.000202000 | 210.651 | 02900076 | 0.000939803 | 0.399437 | 209.144 |